New Jersey Future Blog
Making Savvy, Successful Stormwater Solutions: Why the Municipal Separate Storm Sewer (MS4) Permit Renewal Matters
June 24th, 2022 by New Jersey Future staff
By Andrew Tabas and Bree Callahan
As New Jersey faces increasing rainfall due to climate change and widespread water pollution, effective stormwater management becomes an increasingly important tactic for promoting healthy streams and improved water quality. When it rains, water hits impervious surfaces like streets and roofs, runs into storm drains, and then moves from pipes into rivers, streams, and other waterways. As the water moves along this path, it picks up contaminants like oil and pesticides. However, by treating stormwater at the source, before the contaminants are carried to local waterways, contamination can be effectively mitigated and water quality can be preserved. Green infrastructure, including rain gardens, green roofs, and porous pavement, treats stormwater at the source, which improves water quality.
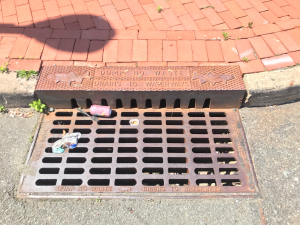
Storm drains collect stormwater and convey it to nearby waterways. The “Dump No Waste: Drains to Waterways” text is an example of public education. The trash caught in the drain shows the importance of regular maintenance. Photo credit: Andrew Tabas. Location: Trenton, NJ.
For 456 municipalities across the state, the Tier A Municipal Separate Storm Sewer Permit (MS4 Permit) outlines rules to reduce water pollution conveyed from storm drains to waterways. For example, the permit prohibits illicit discharges of contaminated water into storm drains. Therefore, the MS4 Permit is a tool that can be used to improve the water quality of New Jersey’s rivers, streams, and lakes.
Every five years, the New Jersey Department of Environmental Protection updates the MS4 permit, which serves as an opportunity to improve its requirements. The current permit, which went into effect on Jan. 1, 2018, does not do enough to address water quality issues for several reasons. First, the 2018 MS4 Permit does not require municipalities to take actions to reduce runoff from existing development. Second, the 2018 MS4 Permit does not require towns to inventory and manage its stormwater infrastructure, including green infrastructure. Third, the 2018 MS4 Permit fails to address New Jersey’s many impaired streams identified through the Total Maximum Daily Load program adequately. Given the existing permit’s shortcomings, the permit renewal scheduled for Jan. 1, 2023 is a critical opportunity to improve water quality across New Jersey.
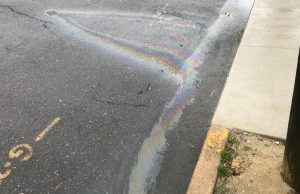
Stormwater picks up oil, trash, and other contaminants. If this stormwater is conveyed to streams without treatment, it brings the contaminants with it. Photo credit: Andrew Tabas. Location: Bordentown, NJ.
To meaningfully improve water quality in our state, New Jersey Future is advocating for the following to be incorporated in the 2023 permit renewal:
- Consistent emphasis on green infrastructure best management practices as viable and often preferable methods to reduce the amount of stormwater in the storm sewer system.
- Requirement for municipalities to develop results-driven Watershed Improvement Plans that include metrics for water quality and/or flooding improvements.
- Robust technical assistance, training, monitoring, and enforcement to support and incentivize communities to proactively and efficiently manage and minimize their stormwater.

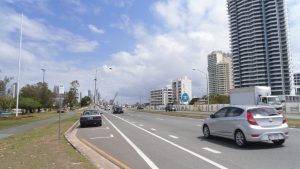
Pipes convey stormwater from impervious surfaces into the Delaware River. Photo credit: Andrew Tabas. Location: Trenton, NJ.
To fund these improvements, New Jersey localities now have the option to establish stormwater utilities. Similar to any other utilities, such as water or gas, stormwater utilities are a dedicated funding mechanism used to pay solely for stormwater management. Property owners are charged a user fee based on the amount of stormwater that their property contributes to the stormwater system. Throughout the United States, stormwater utilities are widely considered the most equitable and stable approach for funding stormwater management programs.
In the past few years, loss of life, impaired water quality, interruptions in business, and millions of dollars worth of property damage have made it clear that the incentives for making smart stormwater decisions have never been higher. New Jersey Future and our partners support a stronger MS4 Permit to improve water quality, build resilience, and reduce risk. Stay tuned for NJDEP’s release of the final draft permit this summer to submit your comments to NJDEP!
Young People are Leaving New Jersey: Exploring Potential Explanatory Variables
June 22nd, 2022 by Tim Evans
 With the youngest members of the demographically large Millennial generation (roughly, those born between 1981 and 1996) aging into young adulthood, the number of people between the ages of 25 and 44 increased nationwide by 3.5% between 2015 and 2019.1 In New Jersey, however, the population in this age range declined by 1.2% over the same time period, with high housing costs appearing as a major motivating factor. New Jersey is not producing enough housing, and in particular, not enough of the kind of housing that young adults are looking for–that is, alternatives to the single-family detached home. The lack of supply relative to demand is pushing housing prices and rents upward, causing young adults to leave New Jersey in search of cheaper housing elsewhere.
That is the conclusion of a report prepared by students in a Princeton University class titled “Wall Street and Silicon Valley: Place in the American Economy.” Aaron Shkuda, Project Manager of the Princeton-Mellon Initiative in Architecture, Urbanism, and the Humanities, was the instructor for the class. Tim Evans, New Jersey Future’s Director of Research, served as class advisor.
The students examined the change in New Jersey’s young adult population between 2015 and 2019 compared to the national rate of change and to changes in a selection of other states, chosen to represent both states with housing markets similar to New Jersey’s and less-expensive states that are attracting in-migrants from other parts of the country. In addition to New Jersey, the states included in the study were California, Colorado, Connecticut, Massachusetts, New York, North Carolina, Pennsylvania, Texas, and Washington.
The students also conducted an analysis at the metropolitan level, comparing the seven metropolitan areas that are partly or entirely contained within New Jersey with major metropolitan areas from the other states included in the state-level analysis, plus Atlanta, Chicago, and Washington, DC. Every one of New Jersey’s 21 counties is included in a metropolitan area. The following metropolitan areas contain the listed New Jersey counties:
- New York—Newark—Jersey City, NY-NJ-PA: Bergen, Essex, Hudson, Hunterdon, Middlesex, Monmouth, Morris, Ocean, Passaic, Somerset, Sussex, Union
- Philadelphia—Camden—Wilmington, PA-NJ-DE-MD: Burlington, Camden, Gloucester, Salem
- Allentown—Bethlehem—Easton, PA-NJ: Warren
- Trenton—Princeton, NJ: Mercer
- Atlantic City—Hammonton, NJ: Atlantic
- Vineland—Bridgeton, NJ: Cumberland
- Ocean City, NJ: Cape May
In exploring potential reasons for differences in the growth rates in the young adult population, the students looked at the following variables from the 2015 and 2019 iterations of the one-year American Community Survey:
- Total number of housing units
- Number of housing units of a type other than single-family detached
- Median home value
- Median rent
In each case, New Jersey and its component metropolitan areas lagged the nation in terms of housing production, with the result that its housing costs are well above the national average. The pattern was similar in other Northeastern states and in California, where constrained housing supplies are keeping prices high and appear to be incentivizing young adults to move out of state. The analysis points to a need for New Jersey to supply more housing, and specifically more of the types of housing that young adults can afford. Otherwise, young adults will likely continue to move to other states in search of lower housing costs.
Download the full report.
__________________
1Estimates are from the 2015 and 2019 versions of the one-year American Community Survey
State Guidance for Locating Warehouses is Here
June 10th, 2022 by Peter Kasabach

Photo Credit: Canva
The Office of Planning Advocacy, the staff for the State Planning Commission, has issued first-of-its-kind guidance on where and how warehouses should be located in New Jersey. The guidance will be useful for municipalities looking to direct warehouse development to optimum sites and away from sites that are not appropriate for the community; for community members looking to protect their quality of life while still benefiting from development; for developers looking to meet the growing demand to build warehouses; for counties looking to support good municipal planning; and for state agencies and decision makers looking to further the sustainable, equitable, and practical siting of warehouses through new laws, regulations, and investment decisions.
In recent years, New Jersey has seen an increase in warehouse development. This increase is putting pressure on communities that are already overburdened with pollution, communities soon to be negatively affected by new truck traffic that did not exist before, and on our state’s remaining open spaces. It is critical that the state plan for this new demand in its logistics sector. Critical to this planning is the inclusion of community voices from our urban communities that have been fighting for better air quality and less truck traffic for years.
The new state warehouse guidance can be found at the Office of Planning Advocacy’s website (under Reference Materials section). The office will be accepting public comments by email (warehouses sos
sos njgov) until July 29th. The guidance will then go to the State Planning Commission to be adopted. The Office of Planning Advocacy will review comments before bringing a final copy of the guidance to the August 3rd meeting of the State Planning Commission for the Commission’s approval. The guidance will then go to the State Planning Commission to be adopted. Once adopted, we expect that government agencies and decision makers will put in place the rules, regulations, and investment planning necessary to effectively implement the guidance.
We Need a Better Way of Measuring How Much People Drive—And Why
May 23rd, 2022 by Tim Evans
 People driving cars and trucks from one place to another is not only a big contributor to New Jersey’s carbon footprint, but also leads to many hours wasted behind the wheel and many dollars spent to build and maintain the state’s road network. In New Jersey, the average licensed driver drives about 33 miles a day. While transportation planners and the general public are aware that daily life involves a lot of driving, the reasons for all this vehicular travel are less widely understood. A better way of measuring vehicle-miles traveled (VMT) would provide some insight into the problem—and what to do about it.
The Transportation and Land Use Connection
The transportation sector accounts for 41% of New Jersey’s greenhouse gas (GHG) emissions (according to the NJDEP Greenhouse Gas Emissions Inventory), mainly from cars and trucks burning gasoline and emitting CO2 as they move people and goods around the state. One of the potential avenues for mitigating climate change through the reduction of carbon emissions is to reduce the amount that people need to drive, a strategy that—unlike simply electrifying the vehicle fleet—would also pay multiple other dividends. Less driving would result in less traffic congestion and the waste and aggravation it entails, fewer tax dollars spent on building and maintaining roads, and fewer hours logged behind the wheel for New Jersey’s drivers, allowing more time for leisure and entertainment.
So how might we reduce the number of miles the average person needs to drive? To answer this question, we need to understand the factors that incentivize driving in the first place, particularly in the relationship between land development and transportation. Decisions about where to locate homes, offices, stores, schools, and other public spaces in relation to each other have profound and lasting effects on travel behavior. The farther apart we build different types of destinations, the more vehicular travel will be required to access them. Conversely, when destinations are closer together, car trips get shorter, and some trips can be taken without needing a car at all, whether by non-motorized means or by public transportation, which functions much more efficiently when major destinations are clustered within walking distance of stations.
In other words, travel behavior is a function of land use decisions, and vice versa. Putting destinations farther apart creates a greater need to drive, and the more people drive, the more new development will be built to accommodate car travel. Although this relationship between travel behavior and land use makes intuitive sense, it is not currently the basis on which car travel is measured and interpreted.
We Care About Where People Drive, but Not About Why People Drive
It is often said that a society measures what it cares about, and cares about what it measures. Governments do make efforts to measure driving, but the metrics are primarily based on roads and how many vehicles use them, rather than on the drivers of those vehicles and where they live. The New Jersey Department of Transportation page about measuring VMT explains that “New Jersey’s official estimate of vehicle miles traveled (VMT) is a product of the Highway Performance Monitoring System (HPMS) Program. VMT is a measurement of the amount of traffic on a given mile of roadway. Deriving New Jersey’s VMT estimate involves multiplying the traffic volume on each HPMS section, the section length and expansion factor then summing the product to yield VMT for any desired aggregation level.”
One might infer from its use of traffic counts to measure VMT that the state has an interest in the amount of traffic on its roadways and how extensively those roadways are used, which can indicate where roadway maintenance and improvements are most needed. But measuring VMT based on traffic volumes at particular points on the road network rather than on where vehicle trips originate suggests that our main interests are not so focused on why people drive in the first place. It is difficult to quantify how land development patterns influence travel behavior—and thus difficult to imagine how to reduce the need to drive—if vehicular travel cannot be linked to where drivers live. In order to develop a better understanding of the features of the built environment that prompt people to drive—and to implement land use policies that will allow for less driving in the future— an alternate approach to measuring VMT becomes necessary.
The Value of VMT Data for Explaining Travel Behavior
Fortunately, we already have a device for measuring travel at the level of the individual vehicle: the odometer. Two of New Jersey’s neighbors—Pennsylvania and Delaware—collect odometer readings annually or bi-annually as part of the vehicle registration renewal process. Massachusetts even conducted a Vehicle Census between 2009 and 2014 that made VMT data compiled from odometer readings available at the municipal level. New Jersey’s Motor Vehicle Commission could easily start collecting odometer readings as part of the administrative process and provide the aggregated data to the appropriate state agencies for purposes of studying VMT and monitoring success in reducing it.
Such data would enable miles driven to be associated with residential locations rather than with road segments. Annual odometer readings, when combined with the address at which the vehicle is registered, would allow annual VMT to be tallied by place, ideally at a unit of geography for which data are available to describe some aspects of the built environment. Per-capita VMT for a given unit of geography could be compared to indicators like housing density, mix of uses (residential, retail, etc.), access to public transportation, and other land-use variables that might be expected to affect how much daily travel is likely to take place by car. Examining the relationship between development patterns and driving could yield insights into what kinds of land use solutions might be effective in reducing people’s need to drive.
Aggregating miles traveled by the geographic area of driver residence would also facilitate the modeling of travel behavior as a function of development patterns for purposes of transportation planning. Observing actual driver behavior for different kinds of places would allow transportation planners to anticipate the amount of new VMT likely to be generated by new development of a specific type and density. By combining information about the surrounding development patterns with the approach of the Institute of Transportation Engineers’ Trip Generation Manual, transportation professionals could not only estimate the number of trips likely to be generated by a given land-use type (as facilitated by the Manual), but could also better anticipate both the average trip length of automobile trips and the number of trips that might be taken by non-vehicular means, based on observed travel behavior in places with similar density, mix of uses, and street network connectivity.
Modeling driving behavior as a function of the land development characteristics of where people live, work, and shop would be critical to any effort to estimate the VMT or GHG impacts of new development, as California and Colorado now require, and New Jersey ought to consider.
Being able to observe differences in per-capita VMT among different parts of New Jersey could be helpful in setting realistic VMT reduction targets, by demonstrating possibilities under different land-use scenarios. For example, transportation and land-use professionals could make inferences along these lines: If we could increase the number of New Jerseyans living in places with development patterns similar to, say, Montclair by X%, we could expect to decrease per-capita VMT by Y%, given the observed travel behavior of people already living in such places.
Making Sure Electric Vehicles Pay Their Way
In addition to its potential to inform a GHG reduction strategy based on reducing VMT, measuring VMT based on individual vehicles rather than traffic volumes also has implications for a strategy focused on electrification of the vehicle fleet. Electric vehicles (EVs) figure prominently in the Murphy administration’s (and most of the rest of the world’s) plan for reining in our carbon emissions. But widespread adoption of EVs represents a looming conundrum in terms of raising revenue to pay for our road network: EVs do not burn gasoline and hence do not pay gasoline taxes. Given that these vehicles will continue to use the road network, imposing wear and tear and contributing to congestion right alongside their gasoline-burning peers, how do we ensure that the owners of electric vehicles continue to pay their fair share?
One promising option is a VMT tax, which would collect a per-mile fee from the owner of each vehicle based on the number of miles driven each year. Oregon launched a voluntary program in 2015 to test the concept and is now considering making it mandatory for certain types of vehicles starting in 2026. Utah joined Oregon and started its own pilot program in 2020. The Infrastructure Investment and Jobs Act, which passed last year, includes a pilot program to encourage additional states to implement VMT taxes.
Collecting such fees is impossible if VMT is not tracked at the level of the individual vehicle. Measuring VMT from odometer readings rather than from traffic counts would thus help advance two key prongs of a holistic GHG reduction strategy—the decarbonization of travel and the reduction of the need to travel in the first place. The data would shed light on the relationship between land development patterns and travel behavior, thereby pointing toward land-use solutions that would reduce the need to drive, while at the same time addressing the uncertainties about transportation revenues that will be a vexing byproduct of vehicle electrification. If we care about reducing GHG emissions from the transportation sector, it makes sense to start measuring VMT the right way.
Supporting Equitable Access to Transit and Active Transportation
May 23rd, 2022 by Hannah Reynolds
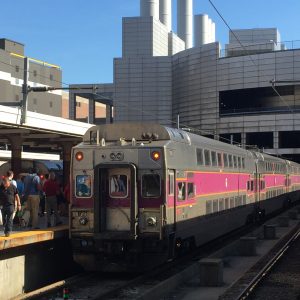
Photo Credit: Emily Eckart
Content warning: This blog post contains discussion of sexual harassment and assault, especially as experienced by women and members of the LGBTQ+ community. If you or someone you know has experienced sexual violence of any kind, you can call 1-800-601-7200, a New Jersey statewide hotline for survivors of sexual violence, for support.
Creating opportunities for more people to walk, bike, and take public transit is a critical element of growing and developing smarter. As we improve infrastructure and programs to accomplish this goal, we must make sure that we are improving access for everyone, especially those who have traditionally been, and continue to be, excluded or made to feel less safe in these spaces.
Last year, a Philadelphia man sexually assaulted a woman on a SEPTA train, making national headlines. Just last month, another perpetrator of sexual violence on a SEPTA train was identified. Such threats to safety on public transit may seem like one-off incidents, unfortunate occurrences that were mostly due to being at “the wrong place at the wrong time.” However, violent crime, especially related to gender identity, is pervasive even closer to home. Across New Jersey in 2018, there were nearly 6,000 incidents of crime (excluding fare evasion) reported to NJ Transit Police, including 24 different forms of sex-based crime. As a result, public transportation emerges as a disproportionately dangerous space for female riders, resulting in inequitable utilization of transportation on the basis of sex and gender identity. In order to promote use of these affordable and sustainable modes of transit within cities and communities, it becomes imperative to ensure equitable access by actively acknowledging and addressing the disproportionate risk women face.
Indeed, women and members of the lesbian, gay, bisexual, transgender, and queer (LGBTQ+) communities face particularly high rates of harassment, violence, and inequity when it comes to use of public transit and other modes of transportation. Of the 63% of NYC public transit riders who report experiences of sexual harassment on the subway, 99% identify as female. Furthermore, in a survey of nonbinary and transgender individuals, 34% of respondents reported experiencing some form of discrimination or harm as a result of their gender presentation while using public transit. Clearly, for those who do not identify as cisgender men, harassment and discrimination in public spaces and public transportation becomes a commonplace risk that women, transgender, and nonbinary people are forced to live with. Through all of this, safety emerges as a major barrier to sustainable, affordable transportation within cities for women— especially those in the LGBTQ+ community— and transgender people of color, low-income individuals, and people with disabilities, among other marginalized community members.
In addition to the safety risks posed by public transit options such as trains, buses, and subways, street infrastructure can also contribute considerably to the danger experienced by women and gender-nonconforming people moving within and between communities. Simply existing as a woman or gender-nonconforming person in public spaces can lead to violence, injury, and even death. An estimated 65% of women have experienced street harassment in their lives; public spaces like sidewalks and buses are commonly the first place that teenage girls experience street harassment, from as young as middle-school age. In fact, teen girls have fewer safe, public spaces designed specifically for their use, as compared with their male peers, who often opt to hang out at skateparks, basketball courts, and other male-dominated spaces. In 2015, 14 women were attacked and murdered by men after rejecting their advances, demonstrating a detrimental disrespect for women’s space and comfort that is tacitly accepted in society. On a similar note, for women who opt to bike, one University of Minnesota study suggests that drivers are more likely to invade the space of female bikers than male bikers, demonstrating that even utilizing personal modes of transportation poses a greater risk of harm for women. As a result, it becomes clear that women and gender-nonconforming people are disproportionately discouraged from using public spaces and transit infrastructure. But even if women are at elevated risk when traveling by foot or public transit, these modes of transit offer opportunity for sustainable and affordable mobility within communities. In other words, in order to uphold use of these promising modes of transportation by all people of all backgrounds, efforts to enhance accessibility regardless of gender presentation must be a serious consideration.
Meanwhile, cost acts as another major barrier to access to affordable, efficient, and sustainable transportation options for women, transgender, and nonbinary people. As a result of these ever-present risks of harassment or assault on transit, many women and LGBTQ+ community members opt to take more expensive, inconvenient, and less environmentally friendly transportation options in order to avoid the risks of dangerous—albeit cheaper and more efficient—public transit. Similarly, low-income women are more likely to take public transit or walk to destinations than men and more affluent women, as many of these women lack the means to afford more expensive or less time-consuming transportation options. Low-income women are therefore at greater risk of experiencing physical or sexual violence in these spaces. At the same time, women who live further from urban centers, especially in rural and suburban communities, may find that public transit options are limited, expensive, and inconvenient. Consequently, inequitable access to public transportation becomes not only a matter of gender equity, but an issue of socioeconomic and geographic relevance.
In seeking solutions to make safer, more accessible, and more sustainable public transportation and spaces for women and non-cisgender people, we should prioritize solutions that also make these spaces safer for other traditionally marginalized groups. Especially as our country undergoes a national reckoning in terms of race and police accountability, solutions for equitable transportation options must consider which solutions are most just, equitable, and safe for all women and gender-nonconforming individuals, including people of color, queer people, people with disabilities, and unhoused peoples. In an interview from The Gender Policy report, a person named Janelle demonstrated the importance of considering multiple demographic and social factors in efforts at keeping women and gender-nonconforming people safe, explaining, “I do not feel safe with any police officers, ever. I don’t trust the police, just based on my personal history with them, but also being Black and trans and queer and disabled.”
While perhaps more surveillance will not be effective in decreasing crime or increasing perceptions of safety, as indicated by such concerns around policing, opportunities for sustainable, equitable, safe communities for women and gender-nonconforming people emerge in terms of infrastructure. Within public spaces, the establishment of wider sidewalks and better lit streets, more green spaces, well-maintained parks, enforced speed limits, and dedicated bike lanes (perhaps with a buffer of parked cars to protect bikers) and other transportation infrastructure can help facilitate safe, affordable, and sustainable transportation options for women, such as biking and walking. Creating walkable and bikeable cities has the potential to prevent up to 23 gigatons of carbon dioxide from being emitted in the U.S. alone by midcentury. Furthermore, by creating public transit schedules that accommodate the schedules of care workers and offering transit options that are accessible for older adults and young children in strollers, caregivers—who are predominantly women—can more easily access forms of public transit that are presently designed around the needs of working men. Altogether, the establishment of reliable, affordable, safe, and accessible infrastructure has the opportunity to not only promote gender equity within communities, but also to implement more sustainable modes of travel for the future.
Perhaps most importantly, in order to ensure that women, transgender, and nonbinary people can both access and feel safe in their use of public spaces and transit options, it is crucial to actively solicit their perspectives throughout public planning efforts. In considering areas for investment, such as biking infrastructure, it is important to consider not only where there are the biggest risks for safety, but also who opts not to use such infrastructure due to danger or inaccessibility, especially women and other historically and presently excluded populations. Currently, there is a lack of female, transgender, and nonbinary representation throughout public planning efforts, despite their unique lived experiences related to safety, fear, and inaccessibility of public spaces and transportation. Moving forward, it is crucial to prioritize representation of women and gender-nonconforming people within conversations about public planning and transportation infrastructure, rather than keeping public transit as it is: designed for men, by men. By adapting the planning and design of our communities to the concerns of those who face the most risk, our communities become safer and more accessible for everyone, improving the quality of transit options for all people.
Community Design for All Ages: A New Sustainable Jersey Municipal Action
May 20th, 2022 by New Jersey Future staff
![]() Towns enrolled in the Sustainable Jersey program can now get recognition for completing actions that make their communities more livable. The Sustainable Jersey action, Community Design for All Ages, launched in March 2022, offers several ways for municipalities to engage in age-friendly community-building. New Jersey Future participated in the development of the action, which is based on New Jersey Future’s Creating Great Places To Age: A Community Guide to Implementing Aging-Friendly Land Use Decisions.
Towns enrolled in the Sustainable Jersey program can now get recognition for completing actions that make their communities more livable. The Sustainable Jersey action, Community Design for All Ages, launched in March 2022, offers several ways for municipalities to engage in age-friendly community-building. New Jersey Future participated in the development of the action, which is based on New Jersey Future’s Creating Great Places To Age: A Community Guide to Implementing Aging-Friendly Land Use Decisions.
Designing communities to be age-friendly is relevant for municipalities because New Jersey’s population age 65 and older has grown by almost 25% between 2010 and 2019, and by 33% since 2000. With the changing demographics, now is the time to incorporate age-friendly design into New Jersey’s communities.
Municipalities participating in the Sustainable Jersey program understand the importance of sustainable development and take action to support such efforts. Making communities more livable also makes them more sustainable. And by making communities more livable for older adults, we are making them more livable for everyone.
The design and development characteristics that make a community age-friendly are things that benefit all ages—more green spaces; vibrant downtowns; better walkability, bikeability, and mobility; and a variety of housing options that are financially viable and designed for people of all abilities. Below are a few of the opportunities that emerge out of efforts to promote age-friendly communities:
- Mixed-use centers—with people living near businesses— activate commercial and social activity. Livability is good for the economy.
- Access to transportation options promotes social engagement and personal independence, reducing the impacts associated with social isolation affecting those without the ability or desire to drive on busy roads for every trip, or even to drive cars at all. Residents and visitors of all ages should be able to easily get to appointments, employment, shopping, transit, and civic and recreational places without feeling they are putting themselves at risk.
- Diversified housing stock allows people of all ages, ability levels, and incomes to find suitable homes that are less expensive, easier to maintain, and closer to daily destinations and public amenities. For older adults, finding more suitable housing is especially important as their income decreases, their mobility declines, or they want to downsize for easier maintenance and upkeep.
- Amenities such as parks and community centers provide opportunities for exercise and social interaction, notably among older adults who may no longer have opportunities to interact at the workplace.
The Community Design for All Ages action incentivizes towns to address livability in the context of sustainability and offers them robust guidance for implementing development practices and design features that support people of all ages.
The action centers on development of an age-friendly plan and implementation of actions identified in the plan. A main component of the action is to conduct an age-friendly land use assessment. By conducting the assessment, municipalities will evaluate physical features such as sidewalk conditions, street crossings, streetscape improvements, transportation facilities, community facilities, green spaces, and other aspects of the pedestrian environment including access to key destinations in the community. The assessment also evaluates the town’s zoning regulations, looking for regulations that promote mixed-use town centers and a diverse range of housing options, as well as plans and policies that support livability.
Because any local land use effort will be more likely to succeed if it solicits input from the people who will be affected by it, the action also includes a community engagement component. If a municipality chooses to develop an age-friendly implementation plan through this action, community engagement is a requirement.
When municipalities are doing age-friendly work, it is imperative that they do it equitably. New Jersey Future’s report, Creating Great Places to Age for Every Person In Every Neighborhood, evaluates how demographic subgroups in municipalities may be underrepresented in designs, processes, or beneficial outcomes. Municipalities have the capability to address inequities experienced by subgroups through their plans, policies, and regulations. The assessment includes a Demographic Evaluation Tool designed to reveal socioeconomic disparities among neighborhoods that may have resulted from past discriminatory practices, which can then suggest how the age-friendly planning process can be made more inclusive. By conducting intentional and meaningful community engagement, community needs can drive municipal actions and decisions and underrepresented subgroups can have their voices heard and their needs represented. The Community Design for All Ages action provides a framework for municipalities to conduct inclusive surveys or focus groups to gain input.
Improving age-friendliness is gaining traction in New Jersey because we recognize the value and importance of creating places that are healthy, equitable, and sustainable for people of all ages. And as more towns and advocacy organizations have developed plans and strategies for advancing age-friendly development and design, more channels have become available for interested towns to compare notes and to learn from what is working elsewhere. For example, at least 18 communities and one county have joined the AARP Network of Age-Friendly States and Communities, and several communities in northern New Jersey participate in the Age-Friendly North Jersey Alliance. As recognition grows, partnerships and shared learning networks are fueling greater awareness and implementation of age-friendly plans and actions at the local level. The Community Design for All Ages action makes this framework accessible to more communities and highlights its relationship to urban sustainability.
Many places in New Jersey were built in the era of automobile dominance and were not designed with the needs of older residents in mind. The aging of our population makes it imperative to consider those needs now. The Community Design for All Ages action shows what towns can do to ensure they are good, accessible places to live for people of all ages.
If You Pave It, They Will Park
April 25th, 2022 by Tim Evans
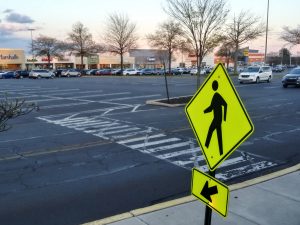
Would you walk here? Parking lots not only push individual buildings farther apart, but they make the experience of walking between buildings unpleasant and unsafe. Photo Credit: Tim Evans
Driving and parking reinforce each other. The provision of parking at every destination encourages people to drive, and the more people drive, the more parking spaces property owners think they need to provide. Fortunately, New Jersey’s older, mixed-use centers show that the pattern can also work in reverse.
New Jersey’s transportation system—and that of the entire United State—is oriented toward the private automobile (now including pickup trucks and sport-utility vehicles), and has been since the 1950s, when construction began on the Interstate Highway System, kicking off an era of massive federal spending on roads. For almost three-quarters of a century at this point, new development has been built under the default assumption that residents, customers, and employees would be arriving and departing by car, and roads have been designed with the primary goal of facilitating easy car travel among destinations.
Part of a car-oriented system is the space required to store all these vehicles when not in use—that is, parking. Driving and parking reinforce each other. The more people drive, the more developers and local planning officials think every new project needs to be surrounded by parking. And the more parking is available at every destination, the more people will tend to drive. Parking lots not only push individual buildings farther apart, but they make the experience of walking between buildings unpleasant and unsafe, further reinforcing the impulse to drive, even between destinations that are relatively close together.
But it wasn’t always like this, nor does it need to remain this way. New Jersey is full of older, walkable, mixed-use centers—not just cities but plenty of pre-1950s suburban downtowns—that were built before the private automobile came to dominate the transportation landscape. Their development patterns are oriented more toward walking and public transportation than toward driving everywhere. As such, they offer a blueprint for how to build in a way that facilitates access by means other than driving, a practice that New Jersey needs to re-learn if it hopes to provide more of the kinds of live-work-play-shop environments that today’s young adults are looking for.
An important part of the equation when designing development for access by means other than just cars is to not require so much parking. Cities around the country are beginning to experiment with dialing back their parking requirements, so that new developments are allowed to look more like the mixed-use, walkable centers that were the norm before governments started pouring money into expansion of the road network. New Jersey should embrace the reexamination of parking requirements, start reclaiming some of its land from vehicles, and put it to better use in improving the quality of life of its residents.
Download the full report.
“Complete Streets” and Goods Delivery: What Is a Street For?
March 24th, 2022 by Tim Evans
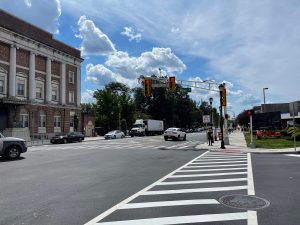
Photo Credit: Bailey Lawrence
The changing nature of shopping means people are more likely to have things delivered to them than go to a store to buy them. At the same time, people increasingly want to live in mixed-use neighborhoods where they can walk to local destinations. How should we be thinking about the safety of pedestrians and other non-motorized travelers in an era of increasing truck traffic?
Port Traffic and E-Commerce: The Twin Drivers of New Jersey’s Goods Movement Boom
The movement, storage, and distribution of freight is big business in New Jersey (and getting bigger). As of the 2019 County Business Patterns report, goods movement industries—roughly, those classified under wholesale trade (NAICS code 42) or transportation and warehousing (NAICS codes 48 and 49)—account for one out of every eight jobs (12.5%) located in New Jersey, the highest percentage among the 50 states.
The boom in goods movement has two main drivers. One is the presence in North Jersey of the nation’s second-busiest container port, the Port of New York and New Jersey, the major facilities of which are located on the New Jersey side of the Hudson River in Newark, Elizabeth, and Bayonne. Because it is centrally located among the Northeast’s constellation of large metropolitan areas, the port is a major point of entry for imported goods arriving from Europe and from the growing economies of South Asia (e.g., India and Pakistan). And the 2016 widening of the Panama Canal means that some ships carrying goods from our major trading partners in East Asia (i.e., China, Japan, South Korea, Taiwan, Vietnam) that are bound for markets in the eastern United States can proceed directly to East Coast ports instead of docking at Los Angeles, Oakland, or Seattle and sending their payloads across the continent by rail. This more direct shipping route from East Asia has boosted the Port of New York and New Jersey’s volume even further. The growth of traffic at the port has sparked a wave of warehouse development across northern and central (and—increasingly—southern) New Jersey, as shippers scramble for spaces for storing, sorting, and distributing all of the incoming freight.
It should be noted that South Jersey has ports too—in Camden, Paulsboro, and Salem—and cargo volume is booming there as well. But the South Jersey ports handle a much smaller volume of cargo than the ports in North Jersey, and they also specialize in bulk commodities like steel, plywood, and cocoa beans that are more likely to be shipped by rail than by truck, making their impact on the state’s road network less pronounced and their land-use footprint less visible.
Unlike the port, the other driver of goods movement is not unique to New Jersey but is happening everywhere: the growth in e-commerce. Instead of driving their personal vehicles downtown or to the mall or the big-box retail center to shop, Americans are increasingly buying their stuff online and having it delivered to their home in someone else’s vehicle—the ubiquitous UPS, FedEx, and Amazon delivery vans. This change in the way people shop is having nationwide effects. According to the 2019 County Business Patterns report, “Transportation and Warehousing led all business sectors with the largest rate of employment growth with an increase of 7.5% in the United States from 2018 to 2019.”
Trucks Everywhere
Almost all freight moves by some variety of truck for at least part of its journey. The growth in e-commerce has indeed spawned corresponding growth in truck traffic. In recognition of the increasing visibility of freight movement on New Jersey’s highways, roads, and streets, the Federal Highway Administration (FHWA) and the New Jersey Department of Transportation (NJDOT) recently hosted a workshop entitled “Freight in our Neighborhoods: Toward a More Complete Street.” One might ask what “freight” is doing in neighborhoods in the first place. But “freight” is really just a collective term for all the stuff that people buy and use, stuff that has to be transported from its point of manufacture or assembly (for domestic goods) or its point of entry into the U.S. (for imported goods) to its final customer. Wherever you have people (and businesses) who want stuff, you will need vehicles to deliver it. As the trucking industry likes to say, “If you bought it, a truck brought it.”
One of the main purposes of the national highway network is to facilitate the movement of goods from one place to another, and these major roads are thus designed with trucks in mind, with wide lanes, gentle curves, long forward sightlines, and infrequent access points (whether exit ramps or at-grade intersections) to minimize interference with the flow of through traffic. They are designed to move large volumes of traffic at high speeds, a function that naturally accommodates vehicles of all sizes. For this reason, larger storage and distribution facilities of the type associated with ports generally tend to locate as close as possible to rail and highway networks, since their “customers” are usually other, smaller warehouses and their distribution networks can extend for hundreds of miles in multiple directions. Access to regional transportation networks is key for these larger facilities.
For smaller distribution facilities, on the other hand, the customer base is final consumers, either individual households (for online shopping) or the retail stores they shop at (for traditional retail). In this case, the locational impetus is to be near where those customers live, which can result in trucks traveling over local streets.
Should “Complete Streets” Include Trucks?
The primary purpose of local streets is to allow circulation within a place, rather than high-speed travel between places. Local travel is much more likely to take place on foot or by other non-motorized means, especially in downtowns and densely populated residential neighborhoods where destinations are close together. Most vehicular trips are taken by local residents in private passenger vehicles at relatively slow speeds. Street networks are often characterized by narrower lanes, on-street parking, and frequent intersections, all of which encourage driver alertness and caution and keep speeds down. The biggest vehicles that local streets are typically expected to accommodate are fire trucks, trash trucks, school buses, and sometimes transit buses.
Introducing large trucks onto local streets that were designed for smaller vehicles, and where pedestrians are frequently present, creates numerous problems. Large trucks with many driver blind spots create a danger to pedestrians, especially when making turning or backing maneuvers. (This is even true for smaller trucks and SUVs as compared to cars.) Trucks generate noise, which can make the pedestrian environment unpleasant. They emit pollutants in their exhaust that degrade the quality of the air and can increase the incidence of asthma in neighborhoods adjacent to roads and streets with high truck volumes. They impede and sometimes obstruct local traffic when they try to negotiate tight turns, when they block lanes while backing into loading docks (or even stopping in the travel lane to unload), or when they must stop when unexpectedly encountering a low overhead clearance or a bridge with a weight limit. They also impose exponentially more damage on road surfaces than do passenger vehicles, which can compound quickly on streets that were not paved with trucks in mind.
The purpose of the FHWA/NJDOT workshop was to raise the issue of how to balance the need to deliver goods to people and local businesses with the needs of other users of local streets, particularly those not inside vehicles. The consideration of the needs of all users of a street segment is what “Complete Streets” policies are meant to promote. In the words of Smart Growth America, complete streets “are designed and operated to prioritize safety, comfort, and access to destinations for all people who use the street, especially people who have experienced systemic underinvestment or whose needs have not been met through a traditional transportation approach, including older adults, people living with disabilities, people who cannot afford or do not have access to a car, and Black, Native, and Hispanic or Latino/a/x communities. Complete Streets make it easy to cross the street, walk to shops, jobs, and schools, bicycle to work, and move actively with assistive devices. They allow buses to run on time and make it safe for people to walk or move actively to and from train stations.”
In practice, this typically translates to equipping streets with features like sidewalks, crosswalks, median strips, pedestrian-only traffic-signal phases, shade trees, and street furniture (benches, street lights, trash cans, bike racks, etc.) that help make pedestrians and other non-motorized users feel safe and comfortable. Certain characteristics of the street itself—like narrow lanes, two-way traffic, and on-street parking—can also enhance the safety of non-drivers by keeping vehicle speeds down and by physically separating pedestrians from moving traffic. Many of these considerations would appear to be negatively affected by the presence of trucks, raising questions about whether trucks must be accommodated on all road segments, particularly those hosting large numbers of non-motorized users.
One section of the workshop focused on how to incorporate street design features that enhance pedestrian safety while still allowing maneuvering room for trucks making local deliveries. For example, curb-lane parking could be prohibited within a given distance of an intersection to create more space for trucks to make turns. Or curb space could be specifically designated for trucks making deliveries. But perhaps a more overarching question is what types of vehicles are appropriate for what types of road or street segments.
Hierarchy of Roads, Hierarchy of Vehicles
The national road network can be characterized as a hierarchy, with the Interstate Highway System at one end serving the longest-distance function—facilitating high-speed, non-stop travel from literally one end of the continent to the other—and local residential streets at the other, which enable people to travel from their homes either directly to local destinations or onto higher-capacity roads that lead to more distant destinations. In between, there is a continuum of roads and streets, with the features of each segment—number of lanes, lane widths, speed limits, frequency of intersections, and the presence or absence of shoulders, sidewalks, driveways and other curb cuts, merging or turning lanes, traffic signals or stop signs, etc.—corresponding to the volume and distance of movements of people and goods that the segment is designed to host.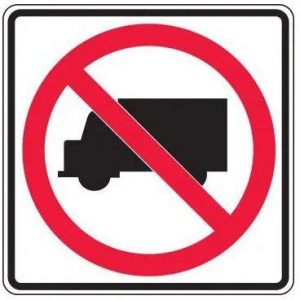
Because different classes of streets and roads are designed for different types and lengths of trip-making, not every road segment will necessarily be appropriate for every mode of travel. Pedestrians and bicycles are generally forbidden on limited-access highways, for example, because these highways need to be designed for high-speed travel by a full range of motorized vehicles, and fast-moving vehicles pose lethal danger to non-motorized travelers. By the same token, then, perhaps most local streets should be off-limits to large trucks, especially in areas with high pedestrian and bicycle volumes. Indeed, the prohibition of trucks on selected local roads is already commonplace. Some vehicle types or modes of travel are simply incompatible with the primary function of certain road segments, and the transportation planning profession should recognize this for local streets the same way it already does for limited-access highways.
The Right Delivery Vehicle for the Right Street
Not every final destination for a package needs to be accessible to large trucks. Rather than proposing truck-focused modifications (wider lanes, bigger turning radii, etc.) to local streets in order to accommodate truck deliveries, transportation planners and logistics industry professionals should focus instead on matching the type of delivery vehicle to the environment in which the destination is located. For destinations located immediately adjacent to the National Highway System, or along wide, high-speed, high-volume arterial roads, deliveries by large truck are completely appropriate, since these links in the road network were designed with large vehicles in mind, and the logistics facilities that locate near the highway network generally do so precisely to minimize the need to put large trucks onto local street networks.
But in high-density neighborhoods where many types of destinations are located within easy walking distance and where pedestrians and other non-motorized users are likely to be present, large trucks impose outsized safety and operational impacts. In such places, “last mile” deliveries (whether to retail stores located in downtown areas or to individual households) are better accomplished by smaller vehicles that better fit the scale of the development. This means delivery vans rather than trucks, and in some situations perhaps even electric cargo bikes, which require even less curb (or sidewalk) space than vans, generate far less noise and air pollution, and pose much less of a danger to pedestrians and other non-motorized travelers. The National Association of City Transportation Officials’ (NACTO) Urban Street Design Guide includes guidelines for choosing which size and type of delivery vehicle should serve as the default in which context for purposes of planning for goods deliveries.
The Last Mile
In some cases, truckload deliveries may need to be broken down into smaller loads and transferred into smaller vehicles at peripheral sites before the last-mile delivery is made. Yes, transferring goods from one mode or vehicle to another adds time—and, therefore, expense—to the total cost of a package’s journey from point of origin to final destination. But there are also costs associated with keeping goods in a larger vehicle for the final leg of the trip, namely in the form of negative externalities like safety, traffic, and pollution effects. The cost of transferring goods to smaller vehicles like vans or cargo e-bikes can be thought of as a way of capturing those externalities and making the customer pay more of the true societal costs of having their package delivered directly to their door.
Besides, we already engage in transloading because some vehicle types are not a good fit for some parts of the transportation network. To take an obvious case, most goods that move by rail spend at least part of their journey on a truck, because the rail network does not reach everywhere. Even if a shipment is containerized, it still takes time to move the container from a rail car onto a truck chassis. This time is simply accepted as a part of doing business. Another example is tandem truck trailers, which are not normally allowed on surface streets because of their size, weight, and constrained maneuverability. State departments of transportation set up staging areas immediately off highway interchanges for assembling and disassembling tandem trailer combinations so that the trailers can be hauled individually to and from their off-highway destinations without creating problems on roads that were not designed to handle tandems. Amazon’s delivery centers (the facilities from which goods are actually shipped to individual homes) essentially serve this transloading function already, receiving inbound truckloads of goods on 18-wheelers from larger warehouses and dispersing them in smaller delivery vans. Staging areas for shifting goods from one mode of transport or one type of vehicle to another are not new; the key concept is to keep these transfer facilities at the edge of densely populated areas, so as to keep larger vehicles out of downtowns and residential neighborhoods.
Reevaluating Streets and Roads
Because the shift in the way people shop—and the accompanying reconfiguration of goods distribution—is likely to persist for the foreseeable future, it is important to think about what this means for the use of local street space. If goods are increasingly being shipped directly to people’s homes rather than changing hands at suburban retail complexes to which people drive their own vehicles, then local streets need to be prepared to accommodate delivery vehicles in addition to private automobiles. Even if we require that final deliveries in densely populated areas be accomplished with smaller vehicles that are more compatible with a pedestrian-focused environment, we still need to make space for those smaller vehicles in the places where they will need to stop to make their deliveries. For example, to accommodate more frequent package deliveries, the designation of loading and unloading zones may need to be expanded in areas where curb space is generally scarce and stopping in travel lanes is disruptive. Or centralized pickup facilities could be created at convenient downtown locations, at which packages could be deposited and customers could make the final pickup at their convenience (including on foot when practical), similar to picking up a package at the post office.
More broadly speaking, the increasing presence of trucks on the road network is a good opportunity to revisit the difference between a street and a road. If roads are for moving people and goods from one place to another, while streets are for enabling the circulation of people within a place, then these purposes should be reflected in their design characteristics. In particular, transportation planners and engineers should stop designing local streets as if their purpose is to maximize vehicle throughput, and instead focus on features that make the street safe for pedestrians and other non-motorized users. Last year (2021) was already the deadliest year since 1989 for pedestrians and cyclists in New Jersey, thanks in part to the increasing prevalence of light trucks in the private passenger vehicle fleet, making pedestrian-friendly street design an issue of growing importance.
The relatively recent increase in the popularity of home delivery means that addressing freight movement on local streets is very much a live issue. Among the 50 states, 21 have no complete streets policy at all. Of the 29 that do, only eight mention freight. Conversely, of the 50 statewide freight plans, only 16 mention complete streets (and mostly in passing), according to the FHWA/NJDOT workshop. Complete streets policies tend to be locally focused, while freight plans are regional or statewide, so they typically don’t define their issues and goals at the same scale. Addressing the disconnect between complete streets and freight at the state level thus presents New Jersey with another opportunity to serve as a national leader. We must do our best to rise to the occasion.
Crossroads in New Jersey: Investing in Water Infrastructure “Post-Newark”
February 22nd, 2022 by Bailey Lawrence
The completion of Newark’s lead service line replacement program is more than an achievement—it’s an invitation.
In this pandemic era, marked by simultaneous public health and climate crises, it’s easy to become disillusioned with the prospect of change, and even easier to ignore claims that “this is our last chance.” Every year, month, and day seem to be marked by a new record or all-time low—new research that further underscores the severity of the existential threats we face. Thankfully, for several environmental challenges—including lead in drinking water—we already possess the necessary tools and resources for immediate action.
Many have hailed the completion of Newark’s lead service line (LSL) replacement program earlier this month as an epic milestone, and rightfully so. The most populous city in New Jersey achieved the monumental feat of replacing more than 23,000 LSLs in under three years through a combination of local leadership and community participation, both of which were applauded by U.S. Vice President Kamala Harris during her visit to Newark. In an interview with the New York Times, Lead-Free NJ Advocacy Coordinating Committee Co-chair Yvette Jordan similarly commended the City’s community engagement efforts before emphasizing that “this is a first step, not a last step.”
Indeed, the full value of Newark’s LSL replacement program lies not in its completion, but in what it suggests about what can be accomplished in communities across the state. Thus, following the completion of Newark’s nationally acclaimed program, the conversation across the state—and across the country—has pivoted from what happened in Newark to what should happen next.
It’s an issue that has only grown more urgent since the completion of Newark’s program, as more than 180,000 New Jerseyans were notified this week that their water is delivered through a lead pipe. And that’s not all. According to the New Jersey Department of Environmental Protection, more than one million lines across the state remain uncatalogued. In other words, the customers who received notices this week will not be the last.

New Jersey Future Managing Director of Policy and Water Chris Sturm (far right), poses with LFNJ Advocacy Coordinating Committee Co-chair Yvette Jordan; Joan Leary Matthews, Natural Resources Defense Council; and Radhika Fox, US Environmental Protection Agency. Sturm attended Newark’s commemoration of its completed lead service line replacement program earlier this month.
Luckily, although Vice President Harris presented the completion of Newark’s program as evidence of what the Bipartisan Infrastructure Law can help achieve, this isn’t the only source of federal funding at New Jersey’s disposal. New Jersey Future Managing Director of Policy and Water Chris Sturm, who attended the commemoration of Newark’s completed program, points to the State’s share of American Rescue Plan funds as a critical source of investment for New Jersey’s water infrastructure.
“Unfortunately, the Bipartisan Infrastructure Law won’t provide all of the funding we need,” Sturm said. “We estimate that the funding gap for lead pipe replacement in New Jersey remains between $1.5 billion and $2 billion. It is critical that the State provide additional American Rescue Plan funds to help communities eradicate lead in drinking water and other infrastructure challenges. That’s why New Jersey Future is part of the new Clean Water, Healthy Families, Good Jobs campaign, which is seeking a state investment of $1.2 billion for water infrastructure.”
Sturm is joined by several environmental, business, and labor representatives whose organizations are urging the State to make this historic investment, which will simultaneously advance environmental justice, public health, and economic growth.
We all have a stake in clean water, which can only be secured by an investment that matches the considerable cost of inaction. Very few obstacles have such clearly defined solutions, and if the last few years have taught us anything, it’s that we can’t afford to neglect an opportunity to protect our families and neighbors.
Walking and Biking Are Transportation Too
February 18th, 2022 by Tim Evans
Photo courtesy of Jasmine Grossmann
Last year was the deadliest year since 1989 for pedestrians and bicyclists on New Jersey’s roads. According to New Jersey State Police crash data, the statewide road fatality tally included 220 pedestrians and 23 cyclists, along with 373 vehicle drivers and 84 passengers. More than one-third of the deaths (243 out of 700, or 34.7%) were thus among people who were walking, bicycling, or rolling—our most vulnerable road users.
The last two years have been something of an anomaly, with a global pandemic drastically altering people’s travel behaviors and affecting their mental health. During the first months of the pandemic, a dramatic drop in car travel rather unexpectedly did not lead to a corresponding drop in traffic deaths, as the sudden abundance of wide-open roads seems to have induced drivers to behave more recklessly. And death rates have persisted as traffic has returned, raising questions about the potential staying power of bad habits acquired during the pandemic era.
Troublingly, however, pedestrian deaths had already been creeping upward before the pandemic began. An underappreciated factor in the increasing rate of road deaths among people other than vehicle occupants is the growing popularity of light trucks, mainly pickup trucks and SUVs. Because of their higher suspensions, heavier weights, and more vertical grilles, light trucks are more likely to kill a struck pedestrian as compared to cars and minivans. And some of these same design features also make pedestrians and cyclists harder to see from behind the wheel of a light truck, increasing the likelihood of a collision in the first place. As the number and size of SUVs and pickups have grown, the increase in pedestrian deaths has rapidly outrun the growth in total miles driven. Federal vehicle safety regulations presently do not take the safety of people outside vehicles into account, focusing only on protecting a vehicle’s occupants in the event of a crash.
The recent rise in deaths among pedestrians and cyclists highlights the degree to which the entire transportation system, deliberately or not, pays more attention to vehicles than to the people who use them or share street space with them. Part of the problem is a culture within state transportation agencies of prioritizing the movement of vehicles over the movement of people, even in places with a high density of destinations where many people are on foot (or bikes, or skateboards, or other non-motorized means of transport). Keeping vehicular traffic flowing between places is the purpose of highways, but local streets should primarily be about allowing people—mostly on foot—to circulate within a place, accessing a variety of individual destinations in one central location. Every driver, after all, becomes a pedestrian once they step out of their vehicle in the vicinity of their final destination. By designing local streets as if the primary goal is to maximize the volume of vehicles passing through a place rather than optimizing access to the destinations within that place, transportation professionals are prizing mobility over accessibility and forgetting what streets are ultimately for.
Vehicle design and safety standards may be the province of federal regulators and automobile manufacturers, but street and roadway design are under the control of state and local governments. While the federal government plays catch up in addressing the dangers posed to pedestrians and cyclists by the increasing size and prevalence of light trucks, there are things that New Jersey and its counties and towns can do in the meantime to reduce the likelihood and severity of vehicle-pedestrian crashes. Local officials, engineers, and transportation planners must start designing streets to convey the message that streets are places where people come first, and vehicles are secondary. Features like sidewalks, crosswalks, median strips, pedestrian-only traffic-signal phases, shade trees, and street furniture (benches, street lights, trash cans, bike racks, etc.) help make pedestrians and other non-motorized users feel safe and comfortable. Meanwhile, certain characteristics of the street itself, like narrow lanes, two-way traffic, and on-street parking, can serve to keep vehicle speeds down by encouraging greater driver caution, reducing the likelihood of serious injury in the event of a collision.
Here are some broad steps that state, county, and local governments can take to help make non-motorized travel safer:
- Incentivize transportation planners and engineers to use the National Association of City Transportation Officials’ (NACTO) Urban Street Design Guide in town centers and other areas with good local street grids, where internal circulation is more important than through traffic.
- Update NJDOT’s Complete Streets policy, which dates back to 2009, to make it consistent with the department’s more recently developed (2019) Complete and Green Streets design guidelines.
- Encourage county and local governments to adopt their own Complete and Green Streets policies, again consistent with the Complete and Green Streets design guidelines and using design principles from NJDOT’s Complete Streets Design Guide (from 2017). The NJ Bicycle and Pedestrian Resource Center has a list of counties and municipalities that have done so.
- Encourage local transportation planners to consult New Jersey Transit’s recently updated Transit Friendly Planning: A Guide for New Jersey Communities when making investments in streetscapes and urban open spaces. The guide contains a variety of design techniques that can be used to create more pedestrian-friendly streets. And while the guide is geared specifically toward improving the pedestrian environment around transit stations, its design principles are applicable to any mixed-use downtown, whether or not a transit station is present. “Transit-oriented development” is ultimately about pedestrian-oriented development, since everyone is a pedestrian once they step off the bus, train, or subway.
If New Jersey is serious about reducing its carbon footprint to help mitigate the effects of climate change, a key part of the strategy should be finding ways to enable people to drive less. And encouraging people to drive less means making sure that alternatives to driving are convenient and safe. Prioritizing non-motorized users when designing local streets can help us cut our greenhouse gas emissions while saving lives in the process.


