New Jersey Future Blog
Equitable, Sustainable Development and Redevelopment for a Bright New Jersey Future
July 8th, 2022 by Michael Atkins
Throughout the 2022 NJ Planning and Redevelopment Conference, co hosts New Jersey Future and the New Jersey Chapter of the American Planning Association sought to convene panels featuring industry experts and community leaders. As one would expect with a “redevelopment” conference, themes of successful and sustainable redevelopment were highlighted in depth, while experts also attempted to educate attendees on diversity and inclusivity practices when developing housing and commercial spaces aimed at improving the lives of New Jersey residents.
“Redevelopment: Solving the Problems of Today, Creating the Community of Tomorrow,” specifically examined the vast opportunity for redevelopment to serve as a tool in addressing current problems within our built environment. Panelists included: Valerie Jackson, director Economic Development with the City of Plainfield; Tanya Marione, director of Planning for Jersey City; Jennifer Credidio of McManimon, Scotland, & Baumann; and Jessica Caldwell, founder of J. Caldwell & Associates.
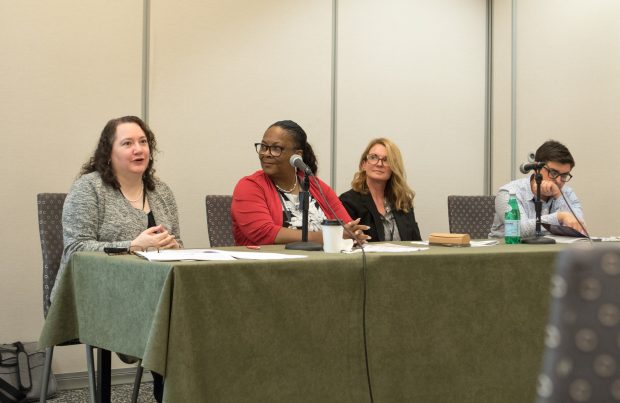
Breakout session “Redevelopment: Solving the Problems of Today, Creating the Community of Tomorrow” during the New Jersey Future and APA-NJ New Jersey Planning and Redevelopment Conference 2022 at the Hyatt Regency, New Brunswick on June 16, 2022. Photo Credit: Keith Muccilli
New Jersey’s redevelopment law provides local governments with enhanced planning, zoning, contract and financial powers. These powers can produce economic value where the private markets cannot, and enhance municipal control over design, development, and implementation. Some of these economic incentives for redevelopment include: long-term tax exemption, grants or loans in aid of redevelopment projects, land acquisition and condemnation, redevelopment area financing, and developer eligibility for state incentives.
“Land is limited, so you have to be very strategic about redevelopment and land use,” said Valerie Jackson of Plainfield. Panelists brought case studies from their respective New Jersey cities and towns where redevelopment has afforded them the latitude to exert control in reinvigorating their communities. Examples include a shopping center that now lack the grocery store that once anchored the center, an abandoned quarry, a former hospital, and town centers in need of new investment and enterprise. Jersey City has a major redevelopment in the works. The City plans to redevelop and infill the former Honeywell industrial site and implement the City’s first new neighborhood in decades. The site promises thousands of units and 35% affordable housing, which will make it the largest mixed-income community in the tri-state area.
While redevelopment affords cities great control in encouraging redevelopment to vacant, abandoned, or underutilized lands, this reveals a broader question of how to foster diversity, equity, and inclusion within development projects and firms. This question was addressed head on at “Developers and DEI: Overcoming the Obstacles.” This panel featured developers Adenah Bayoh and Patrick Terborg; Eileen Della Volle, vice president of business development at KS Engineers; Attorney Jong Sook Nee, and Ron Scott Bay, chairman of Planning Board of Plainfield, NJ.
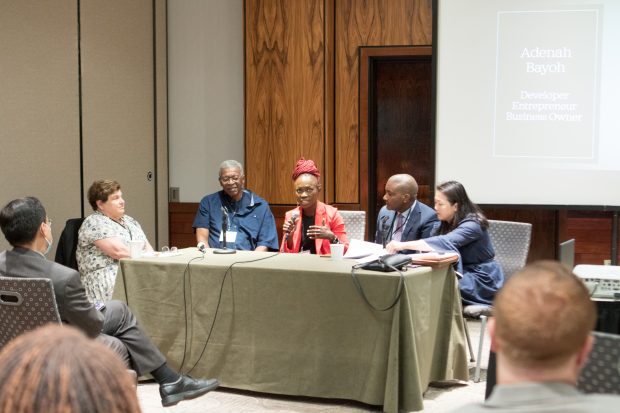
Breakout session “Developers and DEI: Overcoming the Obstacles” during the New Jersey Future and APA-NJ New Jersey Planning and Redevelopment Conference 2022 at the Hyatt Regency, New Brunswick on June 16, 2022. Photo Credit: Keith Muccilli
The panelists broadly agreed that developers must embrace the changing landscape that has more heavily emphasized diversity, equity and inclusion (DEI). Failure to do so results in missed opportunities, underserved communities, and money left on the table that developers would have otherwise capitalized upon with an integrated approach to building to community needs. Patrick Terborg punctuated this point succinctly, “you can make money by embracing diversity.”
Adenah Bayoh shared, “People are sometimes trying to be invisible, which doesn’t mean they have no rights.” She added that experience and representation matters on a given developer’s team as they seek to construct diverse and/or mixed-use communities, including adding a member of the community to the project team to inform project goals and implementation. Eileen Della Volle concurred, underscoring the importance of diversity by adding, “People may be diverse because of their experiences, and that is a valuable contribution, too.”
Ron Scott Bay further encouraged developers to open up to community inputs by imploring developers to “be open-minded” and acknowledge that “everyone should have an opportunity, not just a select few” with respect to serving on developer teams or living in newly constructed housing units. Patrick Terborg encouraged developers to “be intentional” when considering hiring and soliciting community input for development projects. Encouraging audience members to consider “who you can use that would add value and may be of color.”
In conclusion the panelists encouraged developers in the audience to embrace DEI by valuing team inputs and taking continual stock that DEI principles. Opportunities to embrace DEI include during hiring and promotion, project inputs, training and education of staff members and consultants, sourcing goods and services for a development project, and, importantly, conducting true outreach and emphasizing mutual understanding between developers and the communities they work with.
Constructing Accessible and Inclusive Communities for People with Disabilities
July 8th, 2022 by Hannah Reynolds
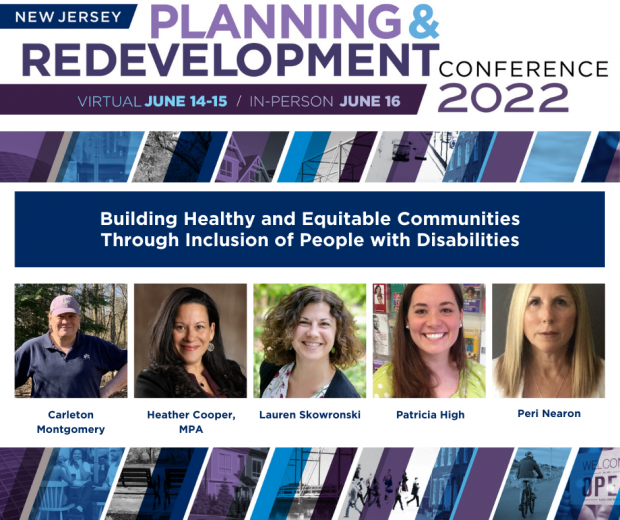 “Inclusion means different things for different people,” stated Carleton Montgomery, Executive Director of the Pinelands Preservation Alliance. “[With] the vast demand for accessible nature, [people are looking for] inclusion, not just being out in nature. That might mean a stable trail, being able to paddle…,” continued Montgomery as a panelist at the 2022 NJ Planning and Redevelopment Conference (NJPRC), sponsored by New Jersey Future and the New Jersey chapter of the American Planning Association.
While an estimated 13% of people from South Jersey have a disability, Montgomery acknowledged that with friends, loved ones, and caregivers of New Jerseyans with disabilities, as much as half of the population might be affected by the inaccessibility of nature. By fostering inclusive use of the Pinelands through both the construction of secure trails and the creation of guided tours and paddling trips accessible to people with mobility-related disabilities, Montgomery and the Pinelands Preservation Alliance seek to encourage all New Jerseyans to care about and protect the region.
The virtual breakout session at which Montgomery spoke, titled Building Healthy and Equitable Communities Through Inclusion of People with Disabilities, was facilitated by Peri Nearon—Executive Director of the Division of Disability Services in the New Jersey Department of Human Services—on Wednesday, June 15. The event featured four engaging speakers, including Montgomery; Patricia High, Assistant Public Health Coordinator of the Ocean County Health Department; Lauren Skowronski, Program Director for Community Engagement at Sustainable Jersey; and Heather Cooper, MPA, Deputy Mayor of Evesham Township. Throughout the session, the speakers clearly articulated how imperative it is to uplift the needs and ideas of people with disabilities in their public planning work.
“Every public space should have easy public access. [We need to] care for all people in all places,” explained Heather Cooper, Deputy Mayor of Evesham Township. Cooper explained how in her role as deputy mayor, she had worked to foster inclusive participation of people with disabilities in town boards and programs; administered community surveys on accessibility; engaged town employees, citizens, and affiliates in educational efforts on access and inclusion; and sought to offer competitive employment opportunities for people with disabilities in Evesham Township.
Lauren Skowronski of Sustainable Jersey echoed the sentiments shared by Cooper and Montgomery about equitable access to public spaces as a means of connecting people with disabilities within the communities in the face of isolation. “We [put] policies and strategies in place to ensure that public facilities are built beyond the code requirements for true accessibility… When the municipality is notified public spaces are not accessible, they acknowledge and take action [to make these spaces more inclusive]… [In making these decisions], we need to engage the opinions of all residents [for] better involvement in municipal decision making.”
What might these accessible, inclusive public spaces look like? Patricia High of the Ocean County Health Department offered an answer. In her presentation, High shared about Tom River’s Field of Dreams, a 100% Americans with Disability Act (ADA)-compliant facility in Ocean County. The Field of Dreams was a garden with a wheelchair-accessible trampoline, zipline, and mini golf; a quiet corner for people with autism and other diverse needs; and a range of other accessible and inclusive features. High explained that the garden was created as an attempt to establish “inclusive gardening for all, cultivating health for all.”
Ultimately, the Building Healthy and Equitable Communities Through Inclusion of People with Disabilities panel at the NJPRC offered an opportunity to engage with equity and inclusion from a perspective that is too often neglected in public planning and redevelopment efforts, by planning and developing public spaces to specifically cater to the needs of New Jerseyans with disabilities. Parks accessibility is a crucial ingredient in fostering a strong connection between New Jerseyans and public spaces in their communities. By designing spaces to include persons with disabilities, developers, planners, business owners, and municipal leaders can expand the number of individuals that visit these spaces, whether more natural spaces like the Pinelands or more constructed spaces like the Field of Dreams farm. During the session, the panelists demonstrated that by building inclusive communities for people with disabilities, these communities will be made more accessible and welcoming for all New Jerseyans.
Beyond Getting from A to B: Ensuring Safer and Fairer Ways to Move Around
July 8th, 2022 by Michael Atkins
 Transportation emissions comprise over 40% of New Jersey’s total greenhouse gases (GHG). Expanding bus and rail transportation options beyond cars not only addresses reduction of GHGs, it also increases affordability and improves general public health by getting transit users to walk or bike to popular modes of mass transit. In encouraging further adoption of public transit, planners, transportation agencies, and civic leaders must establish safety and fairness in order to achieve less vehicle miles traveled (VMT) to meet our climate change goals and foster healthy, walkable communities throughout New Jersey.
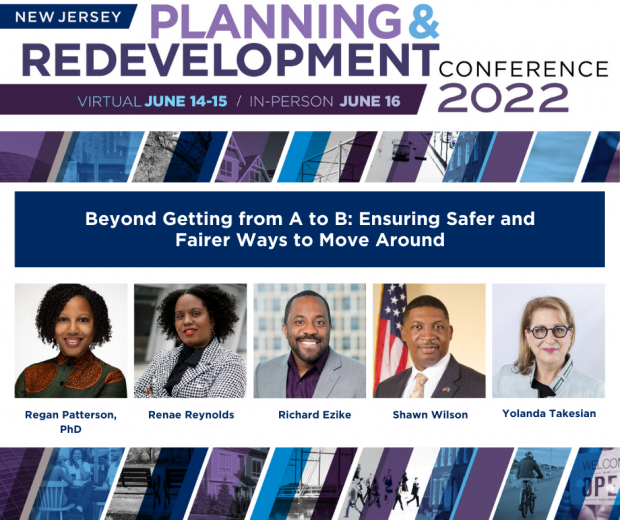
A panel titled “Beyond Getting from A to B: Ensuring Safer and Fairer Ways to Move Around” addressed just these intersecting issues at the 2022 NJ Planning and Redevelopment Conference (NJPRC), sponsored by New Jersey Future and the New Jersey chapter of the American Planning Association.
Transportation today showcases a number of inequities in our built environment ranging from air quality to accessibility. Historically, federal funding and state departments of transportation (DOTs) have measured successful projects by vehicle speeds, which has incentivized the erection of freeways and their widening to attempt to alleviate congestion. This emphasis also encourages even persons of limited means in our society to consider the world as car-centric. Now, a shift in attitudes has led transportation professionals and officials to prioritize multi-modal and public transportation options, in order to ensure safety and equity to increase transit ridership, thereby reducing VMTs.
Panelists brought a broad range of experiences to the discussion, and an even greater depth of on-the-ground experience. They included: moderator Renae Reynolds, Executive Director of the Tri-State Transportation Campaign; Regan Patterson, PhD, Transportation Equity Research Fellow with the Congressional Black Caucus Foundation; Richard Ezike, PhD, Director of Infrastructure and Planning at CHPlanning Limited; Shawn Wilson, PhD, Secretary of the Louisiana Department of Transportation and Development and President of the American Association of State Highway and Transportation Officials (AASHTO); and Yolanda Takesian, Principal Planner of Kittelson & Associates.
In his keynote remarks, panelist Dr. Shawn Wilson conceded there is ample room for improvement within the transit sector. “The development of the transportation system has historically prioritized highways and focused on a limited range of users. That’s just the history of where we are.” Wilson reported that AASHTO’s Board of Directors passed a unanimous declaration in 2020 acknowledging the inequities of the past, and the negative impacts these transportation priorities have disproportionately affected Black and Brown communities. “As the state DOT community, we are committed to serve as stewards of an integrated, multi-modal transportation system that achieves economic, environmental, and social goals set by the representatives of the people we serve.”
Dr. Regan Patterson noted a disproportionate impact transportation inequality has on women, and the challenges they face in all modes of transportation. “Gender is as important as a disparity as race. Women are predominantly the caregivers of their family, so if the primary person needing care is in a wheelchair or is a child, is the sidewalk safe for their usage? Do women feel safe when walking or riding public transportation?”
“The most unsafe place for a pedestrian to be is within the vicinity of a bus stop,” warned paneliest Yolanda Takesian. “Adding a safety metric is crucial,” she added while highlighting the impacts of Vision Zero and Complete Streets programs across American cities to transform urban arterials – where jobs, restaurants, and retail stores often cluster – into safe pedestrian corridors, with protected bike lanes, and frequent bus service.
Takesian emphasized the importance of community conversations in building popular support behind these streetscape adjustments and encouraged community leaders and engineers to make the time to develop personal connections with the corridors they plan and redesign. “We need to recognize the value of lived experience” in reimagining our transportation system.
Dr. Richard Ezike built upon this prescription, suggesting the key to success is to ensure that “the community feels like they are being listened to and being heard and have a say in actual development.” Ezike supported the idea that the adjustment away from speeds is improving safety and access throughout the transportation system. Ezike also noted that “workforce development builds equity” and that hiring practices in resurfacing and redesigning streets to be people-oriented is a major opportunity to train and employ members of underserved communities.
Dr. Patterson pointed to consistent community organizing around environmental justice that has built energy behind audacious adjustments, such as highway removal in the states of California and Washington, and the allocation of Federal funding to address these issues throughout the nation. Audience members demonstrated a particularly acute interest in urban highway removal and historic inequities with state DOTs and the Federal Highway (FHWA).
Dr. Wilson offered an important perspective to attendees and panelists interested in addressing safety and equity in adapting our sprawling transportation system to 21st century challenges. Wilson noted the tendency to scale projects too big (to attract more funding in transforming a corridor), or too small (to avoid controversy, or in the name of expediency.). “We scale [transit] projects to multi-billion dollar size that are unaffordable, or conduct spot improvement projects that address a collision hotspot but ignore corridor connectivity.” While transportation agencies, planners and the public agree that safety and access are primary objectives in updating our transportation infrastructure, it remains a long road to hoe to realize a more equitable and inclusive system. Reimagining our transportation system includes remaking our cities and towns to offer a plethora of transit options and for those options to be safe and inclusive for all types of riders. In doing so, we can reduce our harmful emissions while improving affordability and public health outcomes with a robust multi-modal transportation system.
Demonstration Projects: Seeing is Believing—Doing is Achieving
July 8th, 2022 by Patricia Dunkak
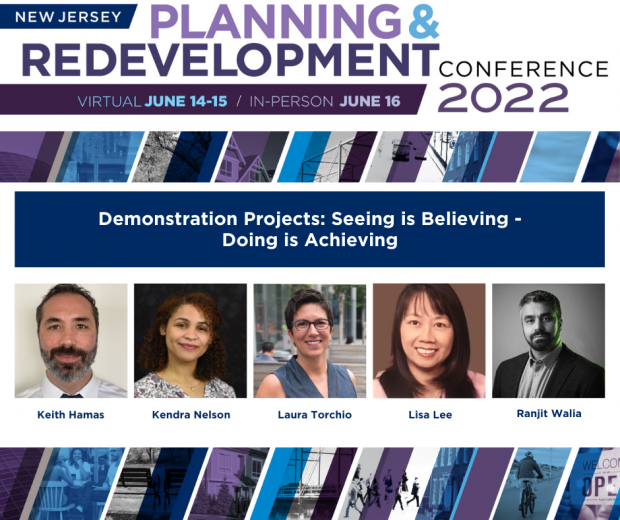 “Streets make-up up to 80% of every communities’ public space. What if we start to think of streets as places for people, as well as places to move and store cars?” Moderator Laura Torchio of NV5 asked viewers to consider streets as places during the 2022 NJ Planning and Redevelopment Conference. For large design projects that alter current transportation design and systems, oftentimes the largest obstacle is public resistance to change in current habits. The session, Demonstration Projects: Seeing is Believing – Doing is Achieving, explored how demonstration projects in three New Jersey municipalities can lead to long-term design solutions that reduce vehicle miles traveled, increase transportation options, promote economic growth through infrastructure investments, and create better public spaces for all users.
Demonstration projects are short-term, low-cost, temporary projects used to pilot long-term design solutions that can improve transportation options for all users and upgrade public spaces. This concept of “try before you buy” creates an opportunity for public participation in transportation projects, which can reduce resistance to new designs. Temporary projects are non-threatening to a community’s current system and habits, and often lead to permanent projects supported by the community. The breakout session panel explored case studies and examples of successful demonstration projects—also known as tactical urbanism—that created more complete streets designed for all pedestrians, cyclists, and drivers.
Public engagement assists planners in making informed decisions for complete streets projects. Keith Hamas of the North Jersey Transportation Planning Authority explained how Keyport Borough in Monmouth County used a virtual video game style system that allowed for survey participants to rate their streets and provide feedback on bike networks, access to schools, and stormwater management. Feedback from this outreach plan led to a selection of a high profile location that would generate enthusiasm for walkers and cyclists, while addressing a safety issue that exemplifies a complete street design. Ultimately, this temporary bike lane improved accessibility and showcased the benefits of safe crossing trails and enhancing a public space for non-drivers.
Experimental Pop-Ups are a new initiative organized by the Delaware Valley Regional Planning Commission to help communities plan and execute tactical urbanism, including bike lanes and traffic circles. Kendra Nelson of DVRPC highlighted various stakeholder groups that played a pivotal role in executing an Experimental Pop-Up plan in Collingswood. The township indicated interest in providing bike lanes to increase bike passing distance and reduce vehicle speed. The materials for this pop-up design only cost around $10,000, and displayed to Collingswood cyclists and drivers the benefits of what a similar long-term design project would look like.
West Orange is an example of how a demonstration project can generate community support for a long term complete streets design project. EZ Ride’s Lisa Lee informed participants of a bike lane project that garnered awareness and support among schools and community groups in West Orange. Feedback from this demonstration project proved that a bike lane would benefit not just cyclists, but community members of all ages. Through an innovative promotional campaign sharing messages stating “Share the Road” and township installed electric signs noting the change in traffic patterns, West Orange cyclists and drivers experienced a shift in how they viewed transportation options in their town. This gradual shift was non-threatening to the community, as it did not change their streets overnight. This low-cost, temporary bike lane helped stakeholders develop and create a long-term design based on community feedback. This short-term project’s success piloted a permanent bike lane for all users.
All panelists in this session emphasized the importance of public engagement during the demonstration project case studies described in New Jersey. The short-term, low-cost, temporary projects can be used as examples for long term design solutions that shift the makeup of public spaces. These types of projects that allow the community to test an idea before they invest can improve design elements based on public participation. Through collaborative demonstration projects, communities can shift perceptions on transportation and how a complete street should look. These projects can lead to more equitable downtown centers, increase transportation options, promote economic growth through infrastructure investments, and reduce vehicle miles traveled.
Reducing Rain’s Repercussions: Exploring the Potential for Green Infrastructure on Redevelopment Sites
July 8th, 2022 by Andrew Tabas
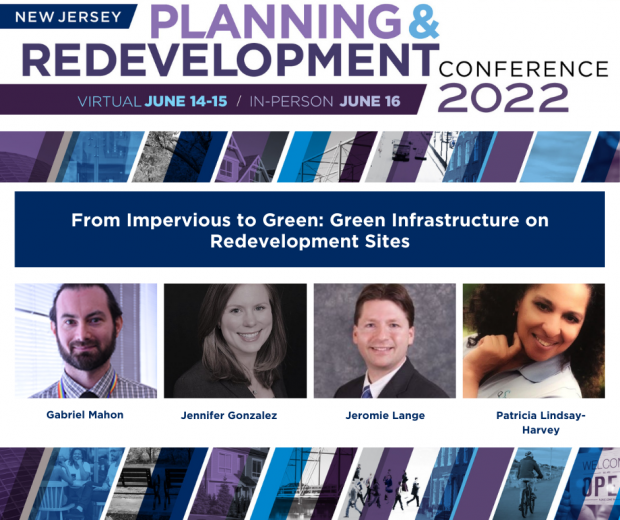 “The benefits of green infrastructure are boundless,” says Jennifer Gonzalez, Director of Environmental Services and Chief Sustainability Officer in Hoboken. Green infrastructure (practices like rain gardens, green roofs, and rain barrels that capture stormwater) can brighten towns through more beautiful streetscapes, reduced flooding, improved health of both people and ecosystems, and increased pollinator habitat. During the “From Impervious to Green: Green Infrastructure on Redevelopment Sites” session at the 2022 NJ Planning and Redevelopment Conference, three stormwater experts joined Jennfer for an exploration of strategies to increase green infrastructure implementation across New Jersey.
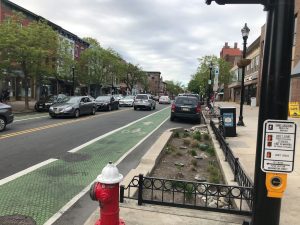
In Hoboken, street trees, rain gardens, and bike lanes make streets more welcoming to all road users while managing stormwater. Photo credit: Andrew Tabas
It is an exciting time for green infrastructure advocates in New Jersey because the New Jersey Department of Environmental Protection (NJDEP) is working on two key regulations. First, NJDEP is in the process of updating the Stormwater Management Rules. As Gabriel Mahon, bureau chief of the Bureau of New Jersey Pollutant Discharge Elimination System (NJPDES) Stormwater Permitting and Water Quality Management in the NJDEP, explained, the current rules require the use of green infrastructure on new “major development” projects. Towns implement the rules through their Stormwater Control Ordinances. Municipalities should stay tuned for the New Jersey Protect Against Climate Threats (NJ PACT) regulations, which may update green infrastructure requirements.
Second, as Mahon explained, NJDEP is also updating the Municipal Separate Storm Sewer System (MS4) Permit. The MS4 Permit determines the way in which towns convey rain from streets and buildings to nearby rivers. Municipalities should prepare for the release of the final draft 2023 MS4 Permit. The preliminary draft permit explored the new idea of requiring municipalities to develop Watershed Improvement Plans, which would be a tool for each town to determine the best way to improve its own water quality.
Patricia Lindsay-Harvey, Willingboro Municipal Utility Authority and Willingboro Green Team Chair, and Jeromie Lange, Director of Development, Active Acquisitions LLC, showed that environment advocates and real estate developers can find common ground on green infrastructure policy. “Not only is green infrastructure necessary, but it’s beautiful; it has a great impact on mental health,” emphasized Lindsay-Harvey. Lange also emphasized his desire to see more green infrastructure implementation in order to “mimic the natural hydrology.” From the developers’ perspective, consistency and a “common sense” application of regulations are critical.
On redevelopment sites, there are many “opportunities for innovation” according to Lange. Mahon of the NJDEP explained that redevelopment projects can count as “major development” under the current Stormwater Management Rules, and that the requirements for these sites depend on the project size and whether there is a net increase in impervious surface. Implementing green infrastructure on redevelopment sites is essential to improving water quality across the state in the long term. In Hoboken, Director of Environmental Services Gonzalez added, the Citywas able to complete a redevelopment project at 7th St. and Jackson St. that managed stormwater above- and below-ground, while providing new community spaces.
All four speakers agreed that it will be essential to manage the stormwater generated by the state’s roads and bridges through the implementation of Complete and Green Streets. This is important because streets contribute to NJ’s overall impervious surface (see below). The New Jersey Department of Transportation (NJDOT) should step up its development of Complete and Green Streets on state-owned roads and should steer funding toward local projects that incorporate green infrastructure, sidewalks, wheelchair accessibility features, and bike lanes.
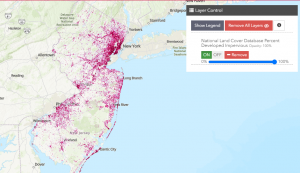
Roads, bridges, and roofs are all examples of impervious surfaces. This map shows the distribution of impervious surfaces in New Jersey. The dark red areas have more impervious surfaces than the lighter areas. Photo credit: New Jersey Water Risk and Equity Map; data from the Multi Resolution Land Characteristics Consortium.
Stormwater utilities (a dedicated funding mechanism for stormwater management in which users are charged a fee based on impervious cover) are one potential tool to incentivize the use of green infrastructure including, as several panelists highlighted, on state-owned streets. The four panelists agreed that effective and well-managed stormwater utilities are essential to promoting green infrastructure across New Jersey.
There are many ways for residents to get involved in the journey of mainstreaming green infrastructure across New Jersey. These include joining the local green team, building a rain garden, motivating students to build green infrastructure at their school, commenting on site plans to support developers who use green infrastructure, and becoming a Green Infrastructure Champion. As Jennifer Gonzalez of Hoboken said, “we are all in this together,” so start your green infrastructure journey today!
Lead by Example: Equitably Addressing the Toxic Lead Issues in Your Town
July 7th, 2022 by Heather Sorge
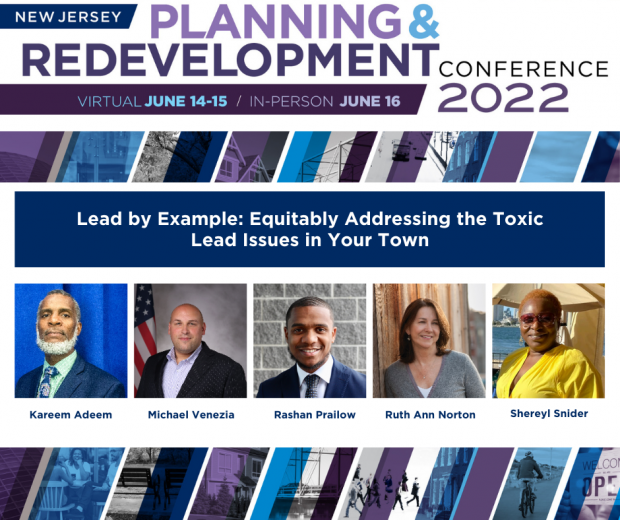 Lead-contaminated paint, water, and soil disproportionately affect young children, causing serious medical and behavioral issues into adulthood, and low-income communities and/or communities of color are most at risk, due to systemic inequities. However, these issues can be prevented by targeting the sources of lead and remediating them.
Lead impacts our entire state, and we have a unique opportunity to address it. What is lead and where is it negatively impacting community health? Once identified, what should cities and municipalities be required to do and when? What are some success stories and some of the obstacles that cities and towns have faced when conducting remediation? These questions were addressed in a session titled “Lead by Example: Equitably Addressing the Toxic Lead Issues in Your Town” at the 2022 NJ Planning and Redevelopment Conference, co-hosted by New Jersey Future and the New Jersey Chapter of the American Planning Association.
Moderated by Rashan Prailow, founder of Think Group LLC, & Co-Chair of Lead-Free NJ, the panel included Kareem Adeem, director of Newark Department of Water & Sewer Utilities’; Michael Venezia, mayor of Bloomfield Township; Ruth Ann Norton, president & CEO of the Green & Healthy Homes Initiative (GHHI); and Shereyl Snider, community organizer with Urban Promise Trenton and the East Trenton Collaborative.
Kareen Adeem began the session by sharing Newark’s journey, and success, in completing their lead service line (LSL) replacement program which began in 2019 and removed over 23,000 LSL’s, impacting 315,000 residents in 31,000 households. Adeem touted the project as one that invested Newark’s physical and human infrastructure by creating jobs and opportunities within the community and improving public health.
Ruth Ann Norton of GHHI spoke of the need to, “advance lead in every program we can to ensure we end its toxic legacy and the stranglehold it has had on health, economic, and social outcomes for far too many communities throughout the state and nation.” Norton went on to say that New Jersey has set a guidepost by aligning our normal lead hazard control, lead abatement activities, testing in water, soil, and paint, and the ability to deliver a lead-free future for New Jerseyans. She stated that equity must be measured along the following yardsticks: children’s ability to attend school healthy and ready to learn, housing stability in a given area or neighborhood,, health care funding t for managed care for hospitals and Medicare, unemployment and a strong jobs framework to maintain local infrastructure, and denormalizing the , expectation that children in low-income housing will be poisoned by lead because it typically is older, distressed housing.
Lead has a significant adverse impact on children’s brain development and can impact learning, behavior, and health of both children and adults affecting how you earn, learn and compete for a lifetime. Risk assessment, testing, and remediation are critical to an area’s success and addressing it is something that mayors and officials can do to make a difference. Mayor Venezia spoke to how Bloomfield Township works with landlords and renters to inspect rentals to develop a plan to remediate lead paint issues, which has had great success. Additionally, when lead was found in Bloomfield Township’s water, the Township developed and implemented plans to address the LSLs, at no cost to residents, through various funding sources.
In Trenton, Shereyl Snider is helping residents advocate for continuation of their LSL program which unfortunately stalled. Snider has been holding listening sessions for residents and working closely with Trenton’s mayor and other advocates to get the word out on the harmful effects of lead to residents through door-knocking, handing out materials, and speaking to residents one-on-one. The East Trenton Collaborative’s work also includes engaging legislators, as well as city and county officials, by pushing for education, testing, and lead remediation with no customer cost share.
It is important that county, city, and town officials understand state mandates and funding opportunities, and work to identify and remediate lead-related issues. Our panelists agreed that accountability, transparency, and communication are the true keys to success. Investing in human capital and including residents in the process of bettering their community will ultimately help ensure healthy, productive, and engaged communities for our future.
“Addressing lead is a moral compass issue for this country around many ill conceived and unjust policies of the past, which gives us a platform to do the right things and do them better.” -Ruth Ann Norton, President & CEO, GHHI
Centering Small Business in Post-Pandemic Redevelopment
July 7th, 2022 by Hannah Reynolds
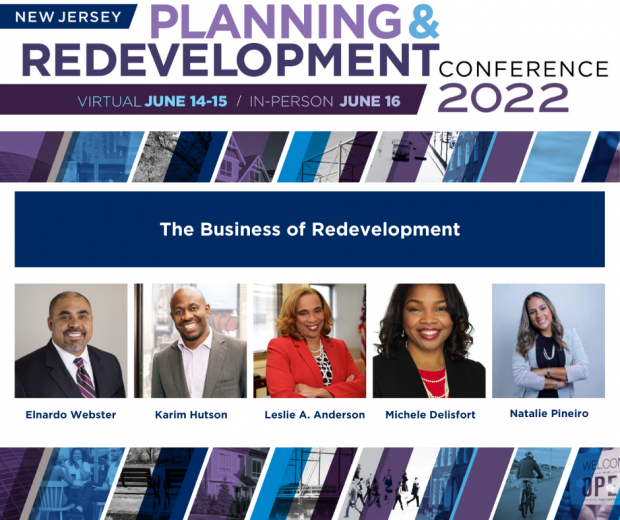 “Think about culture [and] what curating a downtown really means,” invited Natalie Pineiro, executive director of the Downtown Somerville Alliance, at the 2022 NJ Planning and Redevelopment Conference, hosted by New Jersey Future and the New Jersey chapter of the American Planning Association. Pineiro’s comment implored viewers of the breakout session, The Business of Redevelopment, to consider the importance of including diverse voices in planning for downtown revitalization and redevelopment of communities, especially small business owners and community members.
The panel, hosted by Leslie Anderson, the President and CEO of the New Jersey Redevelopment Authority, featured a lineup of four impressive speakers including Pineiro; Elnardo Webster, partner at Inglesino, Webster, Wyciskala, & Taylor, LLC; Karim Hutson,
founder and managing member of Genesis Companies; and Michele Delisfort, principal and managing partner of Nishuane Group, LLC and mayor of Union Township. Throughout the session, all four speakers highlighted the disconnect between profit-driven developers and small business owners lacking the financial resources to pay rent in downtown communities. Repeatedly, the panelists referred to the lack of a ‘universal language’ when it comes to communicating across stakeholder groups: landlords and developers, community members and customers, small business owners, and municipal leaders.
Michele Delisfort, of Nishuane Group, explained that—in her experience with public planning pre- and post-COVID-19—the pandemic shifted relationships between developers, municipalities, and small businesses. In the past, the triparty relationships were often adversarial in nature; the pandemic necessitated greater flexibility as municipal governments sought to work with developers to increase accessibility of rent and to develop and revitalize their communities by encouraging walkable streets and an abundance of small businesses in the downtown areas. In navigating these sometimes contentious collaborations, Delisfort insisted that town leadership had to be flexible and community-driven, with a deep understanding of where the community is in terms of goals and vision.
The pandemic presented other challenges, as well. Karim Hutson, a developer, operator, and business owner with Genesis Companies, explained that COVID-19 has led to far more uncertainty when it comes to development projects. For one, the timing of completion of development projects tends to be more variable than in pre-pandemic times, with shortages of supplies amplifying this uncertainty. Further, Hutson told viewers that uncertainty around the budget and costs of development posed a hindrance to projects, as developers saw spectacular increases in operating costs, the cost of supplies, and insurance prices. These high prices put pressure on the net cash flow associated with developments, thus incentivizing landlords to raise rent to meet the high costs tied to development and owning property. By sourcing supplies and hiring other businesses that are local, developers could contribute to values of community development and sustainable growth. Hutson argued that prioritizing sustainability and long-term community value in development and leasing of property was necessary in order to support both developers and small businesses in communities.
“We are not actually out of the pandemic yet,” Elnardo Webster of Inglesino, Webster, Wyciskala, & Taylor, LLC said during the panel. Webster explained that many of the challenges and negative externalities of the pandemic, including supply chain disruptions, still-remote work schedules, prohibitively expensive real estate, and reduced staffing capacity, were still present even now, nearly two and a half years since the initial Stay At Home public health protocols. Webster proposed that requesting subsidies for affordable rental units for retail could offer support for small businesses that could not otherwise afford rental spaces. This offers a small, local business-focused approach to development that could support the revitalization and redevelopment of downtowns and community centers, a value echoed by many of the panelists.
Altogether, the panel offered a diverse array of perspectives and insightful understandings of how small businesses fit in with community-wide goals at redevelopment. Especially as we emerge from the COVID-19 pandemic, it is crucial to keep development accessible for small and local businesses, if goals at revitalization are to be accomplished. As decisions on development and planning of urban downtowns are made, the panelists emphasized the importance of not only allowing all stakeholders a seat at the table, especially small business owners, but also of ensuring that these underrepresented parties are supported by decision makers with intimate familiarity with their needs. Through open communication and collaboration, hopefully a more universal language for discussing redevelopment can bring together the diverse groups of stakeholders involved in community development planning.
Award-Winning Map Shows Water-Related Environmental Justice Issues in New Jersey
June 30th, 2022 by Guest Author
By Drew Curtis, Pablo Herreros Cantis, Bill Cesanek, Rachel Dawn Davis, Amy Goldsmith, and Andrew Tabas
Download the Spanish Translation. (Español)
The Summer 2021 floods in New Jersey, none more widespread and damaging than following Hurricane Ida, showed the damage that stormwater can wreak on communities. New Jersey Department of Environmental Protection (NJDEP) anticipates that rainfall intensity will increase due to climate change, meaning that flooding will become more frequent. To prepare for future floods, it is essential to understand which areas are at risk of flooding and which communities are in harm’s way.
Jersey Water Works (JWW) developed the NJ Water Risk and Equity Map to gather data on water risks and to understand the potential inequities tied to them. By water risks, we mean a group of public health- and safety- related challenges that are relevant to New Jersey’s communities (such as flooding, lead in drinking water, and surface water quality). The map allows users to explore data showing the different water risks considered, with the aim of helping both NJ residents and decision makers visualize the communities that are most affected by them. Showing the distribution of water-related risks can motivate local and state government officials, advocates, and residents to seek to address these issues.
In 2022, the Water Risk Equity Map was selected for the Water Data Prize in the Equity Category. Read more in this press release!
These two case studies show how the map can be used to understand water and equity issues in New Jersey.
Case Study 1: Visualizing the Impact of Hurricane Sandy on Jersey City’s Overburdened Communities
The first case study examines the impact that Superstorm Sandy had in Jersey City.
Use the search to find Jersey City.
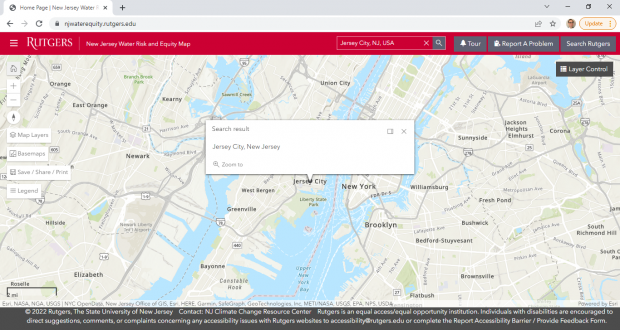 Load the layer that shows the areas inundated due to Sandy by clicking on the “Map Layers” button → “Water Risk Data” → “Flood Risk Data” → “Sandy Surge Extent”. Displaying the layer shows that a substantial part of Jersey City was impacted by Hurricane Sandy.
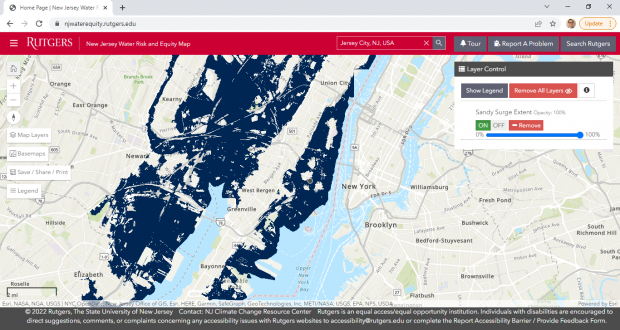
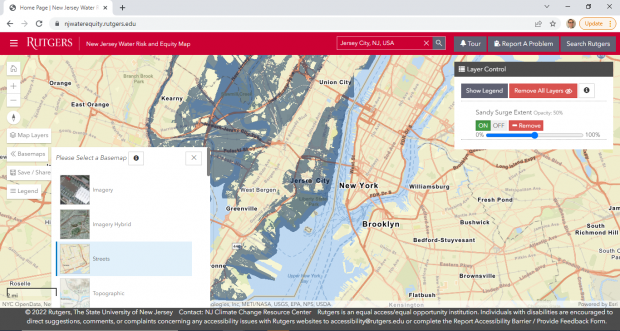
It is possible to change the basemap and the transparency of the layer so that it is easier to read the names of the streets that were affected by the storm. To do this, click on the “Basemaps” panel on the left side of the screen. To change the layer’s transparency, slide the button on the upper right under the Layer Control panel.
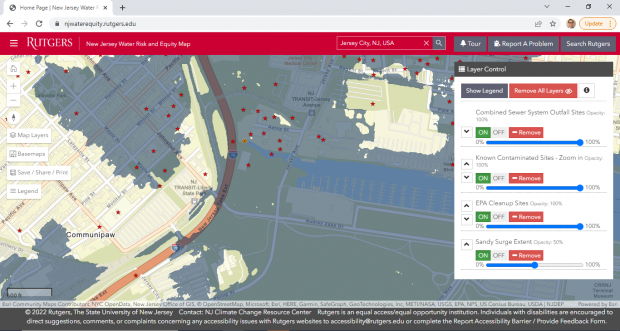
 Now that the layer’s setting and the basemap have been configured, it is possible to zoom into any particular area of interest. For example, we can zoom into the area known as Mill Creek. As the image below shows, Mill Creek was severely affected by Hurricane Sandy, and is known to be a breach point for flooding during storm surge events. The area is also exposed to Combined Sewer Overflow (CSO) discharges, and has several polluted and federally-recognized Environmental Protection Agency (EPA) cleanup sites. CSO outfalls, known polluted sites, and EPA cleanup sites can be added to the map by accessing the layers under “Map Layers” → “Water Risk Data” → “CSO/MS4 Outfalls and Polluted Sites.”
 Finally, the tool includes socioeconomic data relevant to identifying vulnerable communities. For example, it is possible to display overburdened communities (as defined by NJDEP). NJDEP defines “overburdened communities” as areas with 35% or more low-income households, 40% or more Black, Indigenous, or People of Color (BIPOC) residents, or 40% or more limited English proficiency households. As the legend shows, Jersey City has several overburdened communities due to areas that meet the threshold for BIPOC residents, low-income households, or both.
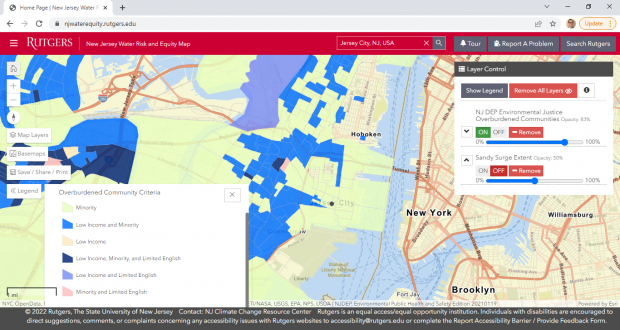
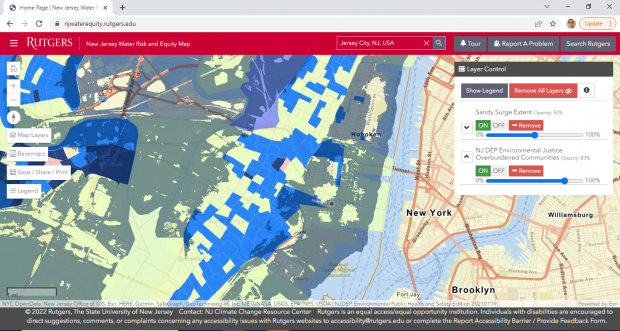
If the Hurricane Sandy surge extent area is reactivated, it becomes clear that many of these vulnerable communities were directly impacted by flooding during the superstorm. The case of Jersey City is comparably different to its neighbor municipality Hoboken, which, while severely affected by Superstorm Sandy, shows a much lower amount of overburdened communities.
 Case Study 2: Hotspots in South Jersey
The second case study examines South Jersey with the aid of the new “hotspot” layer. Hotspots are areas where overburdened communities face high levels of water risks. The map identifies two types of hotspots: Flooding Environmental Justice (EJ) Hotspots and Water Infrastructure Environmental Justice (EJ) Hotspots. (For an explanation of the data that is included in these hotspots, visit our Introduction page.)
First, pull up the Hotspots layer. Areas in blue are Flooding EJ Hotspots, areas in yellow are Water Infrastructure EJ Hotspots, and areas in green are both.
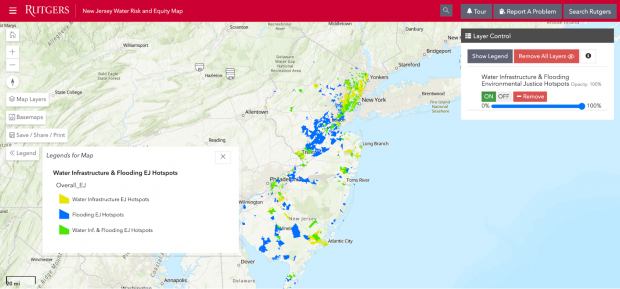 Second, zoom in on South Jersey. As you can see, there are Flooding EJ Hotspots in Vineland, Bridgeton, and Willingboro, among other areas in New Jersey. There are Water Infrastructure EJ Hotspots around Atlantic City. Some areas are both Flooding EJ Hotspots and Water Infrastructure EJ Hotspots, including Camden, Toms River, and parts of Cape May County.
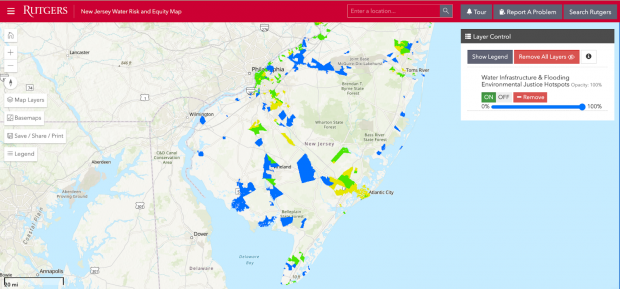 Third, add the area of the Kirkwood-Cohansey aquifer to determine which of these areas are near the drinking water aquifer.
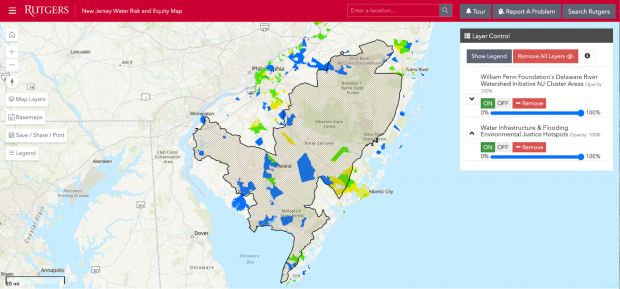 These hotspots are a way to start to explore trends in the data. Remember that many decisions go into building these hotspots. For example, the map highlights overburdened communities to draw attention to environmental justice issues, which means that areas that experience water risks but do not have overburdened communities are not labeled as hotspots. Also, the combination of layers that are included in the analysis necessarily chooses some layers (like the Federal Emergency Management Agency (FEMA) 100-year floodplain) while leaving out others (like brownfields). The Water Risk Equity Map Subcommittee determined the layers that it wanted to include in the hotspot analysis. Map users are encouraged to explore the layers that are most important to them.
To explore the layers that are a priority for you, head to the map and try it out!
Mapping is a powerful tool that can shed light on the environmental risks faced by our society. We hope that you find the Water Risk Equity Map to be an informative tool that is useful in your education and outreach efforts.
Street View: Fostering an Inclusive Community Through Complete and Green Streets
June 29th, 2022 by Aishwarya Devarajan
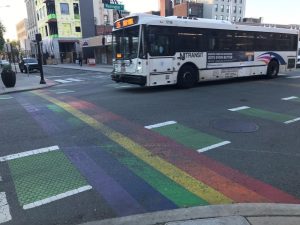
Colorful Crosswalks in Hoboken, New Jersey. Photo Credit: Andrew Tabas
From a satellite view, our streets, our towns, and our lives look picturesque. In reality, we know they are much messier than that. A quick glance at the street view and we see the reality of our towns in a muddy pair of childrens’ boots, hesitating to get on the school bus as a car closely zips behind them; in a little boy and his wheelchair-assisted grandma walking their dog on the gradually shortening shoulder of the road; in a man walking to his car with tires submerged in five inches of stormwater; in a woman looking up from her phone’s weather app which warns her of the poor local air quality as she reaches into her bag to grab her inhaler. As our streets get busier, filled with more stormwater and traffic pollution, and become increasingly inaccessible, implementing complete and green streets (CGS), as well as retrofitting green infrastructure, in our communities is imperative.
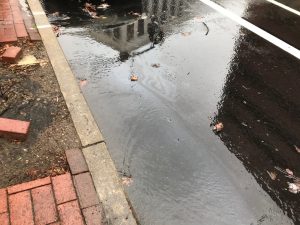
Polluted Stormwater Flooding on a Street in Trenton, New Jersey. Photo Credit: Andrew Tabas
CGS offer opportunities for urban and rural localities to manage stormwater, increase transportation options, support the local economy, and encourage active communities. Feasible implementation requires support from and collaboration between local, state, and federal governments.

Butterfly on a Joe Pye Weed in a Rain Garden. Photo Credit: Aishwarya Devarajan
At the Local Level:
Municipalities can pass ordinances and resolutions to support CGS in their area. These often formalize CGS efforts in a locality and commit to a longer investment. With appropriate planning and collaboration between departments, municipalities can save on much of the cost and work towards the same goal. For example, CGS elements, such as permeable roadways, can be added to a street at the time that the roadway needs to be dug up to access the pipes beneath it. Further, creating a long-term maintenance and funding plan will ensure the sustainability of these projects and reduce long-term repair costs. Retrofitting existing infrastructure with green infrastructure elements can also reduce costs while still maximizing benefits in multi-modal transportation and accessibility, stormwater management, traffic calming, community value and aesthetics.
Public support is essential for successful projects. An educational complete streets demo lab can help all ages of the community to engage with and visualize CGS in their town, and to learn more about the benefits of implementing CGS projects. According to the Collinswood Complete Streets Lab, these demonstrations use “low-cost materials like hay bales, straw, temporary paint and traffic cones, to test out infrastructure in a real-world setting, before investing in a permanent project” to capture local feedback.
At the State Level:
In their Model Complete and Green Streets Policy Guide, NJDOT recommends best practices for CGS and also references their own 2009 CGS policy requiring that “future NJDOT roadway improvement projects include safe accommodations for all users, including bicyclists, pedestrians, transit riders and the mobility-impaired.” This was a great start and NJDOT can do much more. Although NJDOT created this model policy, it is not a policy that NJDOT models.
The recently-enacted Safe Passing Law aims to protect all road users by requiring motorists to “maintain reasonable and safe distance when overtaking pedestrians and certain bicycles.” Further elements of CGS are encouraged and guided through NJDEP’s green infrastructure requirements.
Organizations at the state level that support CGS efforts include:
- Sustainable Jersey
- New Jersey Bicycle and Pedestrian Advisory Council
- Complete Streets Summit
- Jersey Water Works
- New Jersey Future’s Green Infrastructure Municipal Toolkit
At the Federal Level:
Similar to the state level, CGS are not mandated by the federal government. CGS street advocates can turn to the U.S. Department of Transportation’s Administration for safety guidelines, as well as the U.S. Environmental Protection Agency, for further resources.
Local funding efforts can be supported by grants at the state and federal level. Creativity is encouraged as towns can apply for non-CGS specific grants aimed at components that CGS tackle. For example, the U.S. Department of Transportation’s transportation alternatives set aside grant, administered by NJDOT, is aimed at environmental mitigation efforts to address stormwater management which aligns with CGS’ effective management of stormwater runoff and flooding.
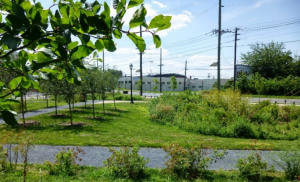
Bioretention area inside the Waterfront South rain gardens in Camden, New Jersey. Photo Credit: Jersey Water Works NJ Green Streets Case Studies
Bigger Picture on Smaller Scales
A functional, sustainable, and economical CGS requires that municipal departments work together, guided by clearly-defined stages and steps that can be found in the town’s CGS ordinance or the many resources available. Fostering inclusive communities through CGS is an achievable goal. By strategically collaborating, together we can create safer communities for all.
We would like to thank our interviewees in NJ, VA, and MI for their time and information.
One Year Later: How NJ Municipalities Have Implemented DEP’s Stormwater Management Rules
June 27th, 2022 by Sasha Weber
It has been just over a year since New Jersey Department of Environmental Protection’s (NJDEP) 2020 amendment to the Stormwater Management Rule (NJAC 7:8) took effect. Since March 2, 2021, NJ municipalities have been required to utilize green infrastructure—systems that mimic natural hydrologic processes to capture and reuse stormwater—as a stormwater management technique on all new public and private major developments (see our March 2021 article for an overview of the new stormwater rules). Localities carry out these requirements through their Stormwater Control Ordinances.
Once enacted, Stormwater Control Ordinances set a threshold for the size of an individual development project. If the project disturbs more than one acre of land, NJDEP requires that it employ green infrastructure. If it disturbs less than one acre of land, green infrastructure is not required.
As of August 2021, 291 New Jersey municipalities have updated their Stormwater Control Ordinances to meet these green infrastructure requirements. Several of these localities have gone above and beyond to further protect their communities from flooding and pollution associated with inadequately managed stormwater.
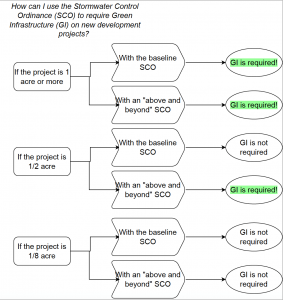
Stormwater Control Ordinances can be used to require green infrastructure. Image Credit: Andrew Tabas
What Constitutes “Above and Beyond?”
In the Enhanced Model Stormwater Ordinance for Municipalities, New Jersey Future (NJF) highlights several steps that municipalities can take to further enhance their Stormwater Control Ordinances and go above and beyond DEP’s requirements. These recommendations for advancement include redefining the threshold for “Major Development;” adding a definition and requirements for “Minor Development;” requiring stormwater management on existing (not just new) impervious surfaces; requiring infiltration of a specific volume of stormwater onsite; and reducing “maximum contributory drainage areas.” All of these changes would increase the amount of green infrastructure in localities.
Case Studies
Curious how some municipalities have implemented and/or gone above and beyond NJDEP’s requirements to reap the benefits of green infrastructure? Check out the following case studies to learn how these requirements are put into action.
Princeton
Princeton defines “major development” as development that disturbs ½ acre or more land or includes 5,000 square feet of impervious surfaces. This requires green infrastructure on more sites than would have been required under NJDEP’s standard definition. Additionally, Princeton requires green infrastructure on “minor development projects.” Regarding the definition of Minor Development by Princeton, Jim Purcell, Princeton’s Assistant Municipal Engineer, shared that “400 square feet “came from an analysis of other municipalities and our own threshold of 500 [square feet]. Another town uses 250, so we settled on 400.”
Since the state requirements went into effect, Princeton has approved a number of projects that implement green infrastructure. For example, there is a recently-dedicated Habitat for Humanity house in Princeton which utilizes several rain barrels, and the municipality also has a rain garden with an underdrain.
Jersey City
Like Princeton, Jersey City also goes above NJDEP’s requirements by employing a definition for “minor development” and modifying the state’s definition of Major Development. Where the NJDEP begins the green infrastructure requirement with projects that disturb more than one acre (43,560 square feet) of land in its Major Development definition, Jersey City includes projects starting at 5,000 square feet in the Minor Development definition. Lindsey Sigmund, an Environmental Planner for Jersey City, worked with the Jersey City Municipal Utilities Authority (JCMUA) to develop this definition.
A recently-approved warehouse for 440 Warehouse Developers LLC with several bioretention basins highlights the new stormwater management requirements.
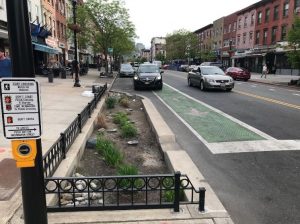
Green infrastructure in Hoboken, NJ captures stormwater while making streets more welcoming. Photo credit: Andrew Tabas.
Hamilton
Hamilton, the largest suburb of Trenton, located within the Delaware River Watershed, meets NJDEP’s requirements in their 2021 Stormwater Control Ordinance. A proposal by Vessel RE Holdings LLC for a multi-family housing development consisting of 60 apartment units across five buildings is considered a Major Development. As such, the project’s Engineering Review from April 2022 notes that the development “includes a combined extended detention and infiltration system to address quantity, quality, and recharge.
For more information and resources on green infrastructure, visit New Jersey Future’s Mainstreaming Green Infrastructure website.
