New Jersey Future Blog
New Resources to Drive New Jersey Toward Green Street Implementation
January 19th, 2022 by Guest Author
By Maureen Krudner, US EPA Region 2
Roadways throughout the nation are a significant source of pollution to local streams, rivers, and lakes. Stormwater runoff controls are essential for preventing pollutants from washing off roads and reducing local flooding. Converting traditional streets to green streets can mitigate these issues. If you would like to know how your community can begin implementing a green streets project, Jersey Water Works (JWW) has two new publications that can help you along.
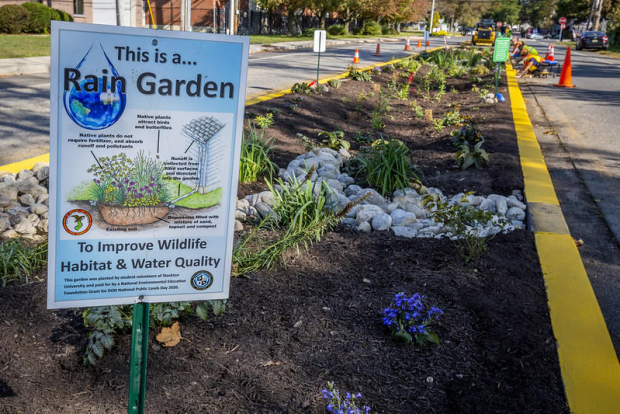
Use JWW’s new resources to learn more about how to plan and fund green infrastructure, like this rain garden in Sea Girt, NJ, in your community. Source: Mark C. Olsen
A green street is a stormwater management approach that incorporates vegetation and engineered systems to slow, filter, and cleanse stormwater runoff from impervious surfaces. Streets comprise a significant percentage of publicly owned land in most communities, offering a unique opportunity to incorporate green infrastructure to improve water quality and community health. Green streets can remove pollutants, replenish groundwater supplies, absorb carbon, improve air quality and neighborhood aesthetics, and provide green connections between parks and open space. They can also improve pedestrian and bicycle safety and calm traffic.
In Sept. 2021, JWW published Planning for Green Streets and Funding Green Streets in the Resources section of its website. These are exciting new resources for green streets implementation.
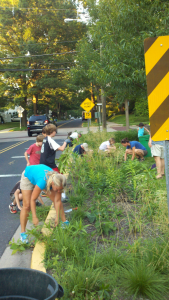
Volunteers maintain a green street in Haddonfield, NJ. Source: Julie Beddingfield.
- Planning for Green Streets outlines the steps needed to get started. The first step is to make sure that green streets are connected to your community’s goals. Effective ways to do this may include adopting a Resolution of Support, developing a Green Streets Policy, and updating local codes. Various agencies need to be included, and things like maintenance and funding need to be considered during the planning process. Educating the public is also important and includes correcting many of the common misconceptions about green infrastructure.
- Funding Green Streets walks you through the several possible funding sources to cover the costs of planning, designing, and installing green streets projects. Over 15 possible funding sources are identified alongside the types of projects that may be eligible. Links to resources for creating a stormwater utility are also included.
If you would like to see how other New Jersey communities have successfully implemented green street projects in their communities, Camden, Hoboken, and Highland Park are featured in the New Jersey Green Streets Case Studies. Additional information on completed green streets projects in New Jersey can be found in the Green Streets in New Jersey Portfolio on the JWW website.
The JWW Green Infrastructure Committee, the Green Infrastructure Champions, and EPA Region 2 partnered to develop these documents. EPA continues to support JWW in its efforts to promote the implementation of green infrastructure throughout New Jersey. If you would like to get involved in JWW, sign up to become a member!
Environmental Justice and Warehouse Sprawl
December 7th, 2021 by Tim Evans
Earlier this year, New Jersey Future released a report about the growth of warehousing in New Jersey, and that growth pressure has only grown more intense in the intervening months. The report focused mainly on the use—and in many cases, the re-use—of land for warehouse development and its impact on host communities in terms of land consumption. The report mentioned, but did not explore in as much detail, the other major negative impact of warehouses: truck traffic. This is a particular concern for areas near the port, where residents have historically experienced a variety of environmental stressors, the legacy of New Jersey’s industrial past.
The desire to prevent truck traffic is a major factor contributing to neighboring residents’ objections to warehouse development, no matter where that development happens. Warehouses attract trucks, and the bigger the warehouse facility, the more or bigger the trucks that drop off or pick up shipments there. In outlying areas near the highway interchanges that are attractive to industrial developers, it is often the case that the local roads were not designed to handle the size and volume of trucks that large distribution facilities will attract.
In neighborhoods in the urban core that are closer to the port itself—and which are therefore even more attractive to the goods movement industry—the problem is more insidious. Here, on top of their contribution to congested roads, the air and noise pollution from trucks is just one of a myriad of environmental hazards that these communities have historically faced, based on past decisions about the siting of various noxious land uses. If port-dependent warehouse facilities are best located near the port itself from a logistical standpoint, how does one guard against further burdening adjacent neighborhoods with additional negative environmental impacts?
The recently passed environmental justice bill (S232) may seem a logical place to look for a solution. But, the law only explicitly targets eight specific land-use types (like incinerators, power plants, or waste-processing facilities) that can be thought of as point-source polluters. In these cases, the function of the site itself produces or emits environmental stressors that degrade air or water quality in the surrounding area. The law was designed to prevent the siting of such facilities in areas that have been historically—and disproportionately— burdened by environmental hazards.
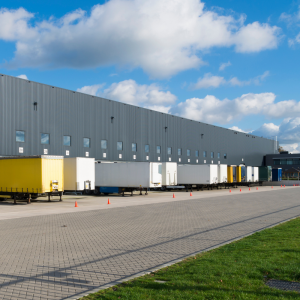
Photo Credit: Canva
Warehouses are not point-source polluters themselves; that is, the on-site functions of storing and sorting merchandise do not inherently generate pollution to the point that they warrant regulatory oversight. Instead, warehouses attract a steady stream of mobile sources of pollution (i.e., trucks). As such, the environmental justice law does not directly apply to warehouses.
The Murphy administration has made environmental justice a priority, pledging to end the siting of environmental hazards in neighborhoods where low-income people and/or people of color live—and especially neighborhoods that are characterized by the presence of both low-income households and people of color. The New Jersey Department of Environmental Protection (NJDEP) has created and now maintains a list of overburdened communities and is charged with ensuring that state agency actions do not result in the siting of additional noxious land uses in these neighborhoods. If the NJDEP lacks direct authority to regulate warehouses from an air-quality perspective, how else might the State bring environmental justice considerations to bear in decisions about where to site warehouses?
One promising avenue is the involvement of the State Planning Commission (SPC). New Jersey Future has already advocated for having the SPC and its staff at the Office of Planning Advocacy prepare a statewide warehousing plan, which would be tasked with identifying appropriate sites for large warehouse developments based on multiple considerations, including the effects on host communities. In addition to the reasons cited in our earlier comments, involving the SPC could be a means by which to introduce environmental justice considerations into siting decisions. A warehouse development plan could, for example, examine the truck travel routes that are and should be taken to minimize harm to communities. It could explicitly include among its criteria the likely effects of warehouse development on overburdened communities in a way that the NJDEP is not presently empowered to do.
The State’s push toward vehicle electrification is another leverage point. The administration’s blueprint for cutting back the state’s carbon footprint, the Global Warming Response Act 80×50 Report, has placed a strong emphasis on vehicle electrification. Trucks are unavoidable in the goods movement industry, and if warehousing continues to locate near the port, trucks will remain a fixture on the adjacent highway network. But, they don’t have to be mobile sources of air pollution. To this end, the various state agency programs aimed at electrifying the vehicle fleet should place a priority on heavy trucks rather than on constructing charging stations for private electric vehicles in upscale suburban neighborhoods.
Environmental Justice communities have been confronting the negative impacts of freight movement for years, and organizations aligned with these interests have been elevating this issue and championing solutions for more than a decade. With the addition of statewide warehouse sprawl to the freight movement and warehousing discussion, a new set of land-use, community, and economic issues have been brought to the foreground. It is important to link the issue of warehouse sprawl with environmental justice issues to develop solutions that are good for communities, the environment, and the economy and to do so in a way that corrects past—and ongoing—injustices.
A short list of old and new recommendations:
- Elevate medium- and heavy-duty vehicles to the top of the priority list for vehicle electrification and deploy them first in overburdened communities. New Jersey should continue to pursue its own version of California’s Advanced Clean Trucks rule and should also continue its existing incentive programs to encourage and assist businesses and institutions in acquiring zero-emissions trucks.
- Prioritize the electrification of the port itself, including on-site equipment and yard tractors, in addition to the over-the-road trucks that pick up or deposit freight there. The recent introduction of the first batch of electric yard goats is a first step in this direction.
- Assign to the SPC and its staff at the Office of Planning Advocacy the task of developing a statewide warehousing plan, the purpose of which is to identify the most appropriate sites for future warehouse development. The plan would establish criteria for identifying these sites, and these criteria should include the likely effects of emissions from heavy trucks on host communities. The SPC should recommend against siting new warehouse developments in environmental justice communities if they are projected to worsen air quality there, using criteria similar to those outlined in S232 regarding the NJDEP’s authority to deny permits to point-source facilities.
From Planning With Purpose to Action for All Ages
December 2nd, 2021 by Tanya Rohrbach
Older adults in the U.S. are projected to outnumber children for the first time in U.S. history. By 2030, all of the baby boom generation will be older than 65 years old, and the baby boom generation is the second largest adult generation behind the millennial generation. With 30% of New Jersey’s population over the age of 55, it’s time to design our communities for all ages.
Just as the urban planning and design sectors—which are white-dominated— are having to confront the effects of whiteness on creating disparities and normalizing exclusionary practices, there’s a growing recognition that community design reflects a history of age bias. The idea of age-friendly cities has its origins in a 1991 United Nations resolution that encouraged national governments to incorporate the principles of aging with independence, participation, care, self-fulfilment, and dignity into their programs. The World Health Organization (WHO) then set forth to develop a policy framework to encourage more prevalent and specific actions at the national, regional, and local levels, and in 2007 developed a global guide to age-friendly cities with a framework outlining eight interconnected domains of urban life that affect the well-being and participation of people as they age into older adulthood. A major focus of the framework involves creating the urban environments necessary for older community members to achieve autonomy, participation, and physical and mental wellness.1
In the U.S., states and local communities around the country are actively incorporating the WHO age-friendly framework into their messaging, policies, plans, and projects. Through the AARP Network of Age-Friendly States and Communities, which has developed the framework into a program advocating for livability, a collection of initiatives are connecting with each other to advance their own programs. In partnership with the NJ AARP chapter and other organizations, New Jersey Future (NJF) is part of a collaborative effort to advance age-friendly state policy and local implementation, and with funding support from The Henry and Marilyn Taub Foundation, the Community Foundation of South Jersey, and the Grotta Fund for Senior Care, we’ve been able to conduct NJ-specific age-friendly research, develop a NJ-specific community guide, and work directly with communities to facilitate their local initiatives.

Photo credit: Tanya Rohrbach
We’re excited to kick off our most recent community initiative facilitation with Livingston Township (Essex County). As champion advocates for older adults in the community, staff of the Senior, Youth & Leisure Services Department recognized the need for the municipality to coordinate its decision-making across leadership, departments, boards, and committees to meet the needs of older adults in the community. The eight domains of urban life outlined in
the age-friendly framework intersect throughout the physical and social components of community life, so meeting the needs of older adults extends beyond providing additional programming or services and into community-wide facets of housing, transportation, pedestrian mobility, and other areas concerning infrastructure and land use. As members of the Livingston age-friendly initiative steering committee recognized immediately through their brainstorming activities, making a community more livable for older populations makes it better for everyone. Livingston was able to dedicate resources to an age-friendly initiative through a grant from the Grotta Fund for Senior Care and will continue to advance its program with an intentional effort to make it community-driven and inclusive. It will apply for membership in the AARP network and develop an age-friendly action plan that will guide an ongoing effort to integrate livability into municipal policy and practice based on community need and participation. The Township will continue its age-friendly initiative as a community partner in the North Jersey Age-Friendly Alliance, which is a network of age-friendly leaders dedicated to building collaboratives and advancing efforts “to improve physical environments, increase housing options, promote transportation alternatives, strengthen social supports and foster intergenerational connections.”
Based on efforts to incorporate age-friendly planning into land use planning or vice versa, NJF has worked with several communities to develop age-friendly land use assessment plans that serve as planning tools for making substantive changes to municipal regulations and programs. We checked in with them to find out how they translated those plans into action.
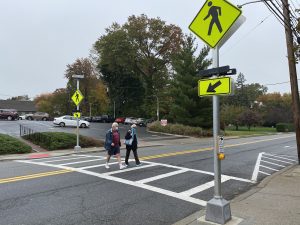
Photo credit: Beth Abbott and Sue Ullrich
Ridgewood Village
In 2020 the Village of Ridgewood installed new lighted crosswalk signage and improved the crosswalk markings and adjacent curbs at a busy crossing in accordance with recommendations in the Aging-Friendly Land-use Assessment for the Village of Ridgewood. Also in 2020, Ridgewood adopted Section 1 of their comprehensive master plan based on an extensive community-wide visioning process. The plan directly reflects the assessment report and input from older residents in the community.
Ridgefield Park Village
The Village of Ridgefield Park is preparing a new master plan and updating zoning regulations, and a “key element of the plan preparation is the aging population of the village and the downtown of the village,” said Ken Ochab, the municipal planner preparing the plan. The Aging-Friendly Land-Use Assessment for the Village of Ridgefield Park “will be the nucleus from which the Master Plan will be prepared,” according to Ochab.
Pompton Lakes
As the Township of Pompton Lakes pursues actions to make the community more livable for all community members, it recognizes the importance of intentional inclusion of its older residents and is aiming to institute an age-friendly coordinator position in the municipality. This position will help to build capacity for an aging-friendly community collaborative in the town and will facilitate community-driven solutions in response to recommendations in the Aging-Friendly Land-Use Assessment for the Borough of Pompton Lakes. For example, Pompton Lakes will work to rehabilitate its civic/senior center, amend land use ordinances, and conduct a housing and transportation needs survey among older residents.
1https://www.who.int/publications/i/item/9789241513500
NJ Residents can Improve Flood Management, one Rain Garden at a Time
November 1st, 2021 by Andrew Tabas
Flooding is a critical issue at all scales. On individual properties, flooding can cause a range of problems, from the risk of pooled water freezing and becoming a slipping hazard to serious damage in basements and ground floors. At the regional level, low-lying areas are vulnerable to severe damage from stormwater that accumulates as it flows downhill. Last month, the remnants of Hurricane Ida reminded New Jersey residents of how impactful flooding can be.
Water engineers tell us that individual community members can work together to solve this problem by building rain gardens. Rain gardens, a type of green infrastructure, are designed to soak up water during storms. On properties with rain gardens, this means less pooled water and more groundwater recharge. The more properties adopt this practice, the more pressure is relieved from the area’s municipal separate storm sewer system or combined sewer system, helping to reduce the extent of flooding downstream.
I decided to build my own rain garden to apply what I have learned through my work on New Jersey Future’s Mainstreaming Green Infrastructure program. The process gave me a better understanding of green infrastructure and how it can bring both stormwater management and aesthetic benefits.
Follow these steps to build a rain garden in your backyard, school, religious institution, municipal building, or other space!
- Plan the rain garden. Start by identifying where you see stormwater collect during storms. Is there a downward-sloping driveway? Does rainwater collect in roof gutters? Use this information to choose the perfect location for the rain garden.
- Make a design for your rain garden. The more stormwater the rain garden needs to treat, the larger it needs to be. Rutgers University’s Rain Garden Manual of New Jersey is a great resource for designing your rain garden.
- Conduct a soil infiltration test to see how well water will drain from the proposed site. Chapter 2 of Rutgers University’s Rain Garden Manual of New Jersey has instructions for how to conduct the soil infiltration test.
- Choose your plants. These should be native plants that can handle large volumes of water.
- Implement your design. Remove grass and soil to the required depth. To make sure that the bottom of the rain garden follows the slope of your design, use a tape measure to keep track of the height at various places in the rain garden.
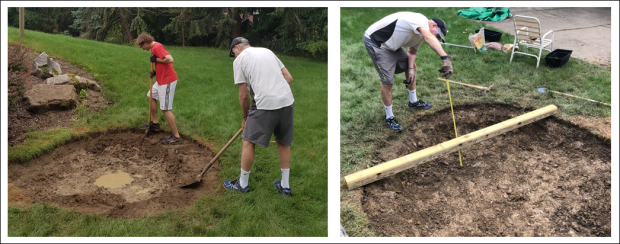
Digging and measuring the depth of the rain garden.
- If the infiltration test indicated that the site drains slowly, add a layer of sandy soil to the site. This will increase the infiltration rate (the speed at which water soaks into the ground).
- Add plants, leaving space between plants so that they can grow over time.
- Add a layer of mulch. The top of the mulch should still be below ground level on the surrounding lawn. See Chapter 3 of Rutgers University’s Rain Garden Manual of New Jersey for additional installation guidance.
- Sustain your creation. Watering and weeding wil help your plants thrive.
- Conduct annual maintenance, including pruning and mulching. Chapter 4 of Rutgers University’s Rain Garden Manual of New Jersey has additional instructions on how to sustain a healthy rain garden.

Maintenance is critical to ensure that green infrastructure is effective. Watering the rain garden shortly after installation will help the plants establish themselves.
Building a rain garden taught me several valuable lessons about green infrastructure. First, leave plenty of time for digging and use hand protection. Removing the required amount of soil took several days of digging with shovels and pickaxes. Second, ask an expert to weigh in on your design. Chris Obropta and Liz Pyshnik at Rutgers University provided valuable insight during the design process. Third, use a tarp to keep stormwater from filling the rain garden during construction. Otherwise, the space will fill up like a bathtub and it will be difficult to continue construction. Fourth, choose native plants that can cope with both flooding and drought. Irises, New England asters, decorative grasses, and arrow arum fulfilled these goals for my rain garden in Pittsburgh, PA.
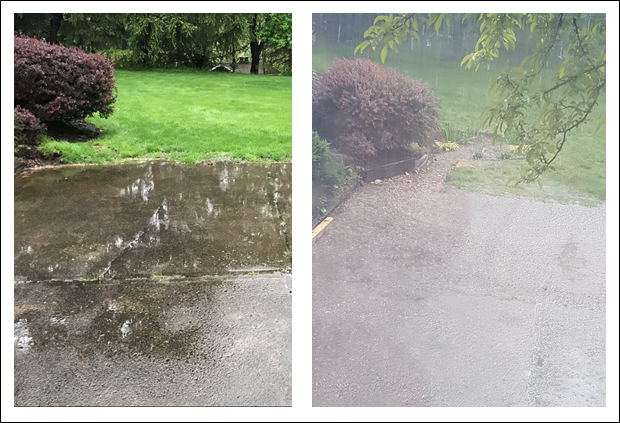
Before the rain garden was constructed (left), water would pool in the driveway. After construction (right), the water has a place to go during storms. The rain garden is typically dry within 24 hours of storms.
While rain gardens look great and prevent flooding, they can also save money! The Clean Stormwater and Flood Reduction Act, passed in 2019, permits NJ localities to create stormwater utilities. Part of the design of a stormwater utility is that properties that construct green infrastructure become eligible for a discount. The rain garden that I built was in a neighborhood of Pittsburgh with a stormwater fee of $8/month. After the township inspected the rain garden, the monthly fee was reduced to $5.60/month, a savings of 30%. To learn more about strategies to incentivize green infrastructure, read this memo by the Jersey Water Works Green Infrastructure Committee.
To get started building rain gardens in your town:
- Build a rain garden in your backyard, school, religious institution, municipal building, or other space!
- Sign up for the Green Infrastructure Champions Program to learn new advocacy strategies.
- Encourage your municipal leaders to update your town’s Stormwater Ordinance to require green infrastructure on development projects.
- Visit the New Jersey Green Infrastructure Municipal Toolkit to learn more.
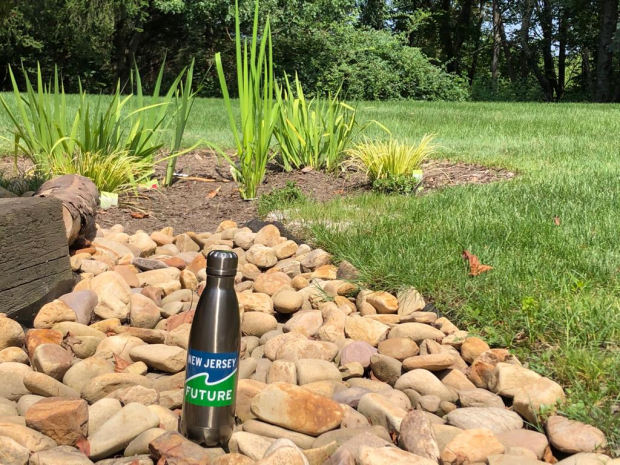
The completed rain garden.
You, too, can bring flood prevention, stormwater runoff quality treatment, and aesthetic improvements to your property by building a rain garden. Special thanks to Gary Tabas, Debra Tabas, Dorothy Heinrich, Liz Pyshnik, and Chris Obropta for their help with this project.
New Jersey Future Welcomes Three New Trustees
October 13th, 2021 by Bailey Lawrence

New Jersey Future’s new trustees Tenisha Malcolm-Wint, Kendra Morris, and Maddy Urbish.
New Jersey Future’s Board of Trustees welcomed three new members:
Tenisha N. Malcolm, director of Cities Programs for The Nature Conservancy, develops strategies that foster nature-based solutions to address community issues statewide. Tenisha has over 10 years of experience in the non-profit sector developing community programs that bridge gaps in public health, public policy, and youth leadership. Her devotion to her personal mission of centering inclusivity and equity spreads beyond her local community, and her impact reaches service groups throughout national and international regions. “I am excited about the direction New Jersey Future is moving in—with a greater focus on equity and working to ensure that the voices of communities that have been unheard are now amplified. I hope to serve as a liaison between New Jersey Future and communities that have not often been brought to the table.”
Kendra F. Morris, director of business development for SUEZ North America, has 15 years of experience developing sustainable public infrastructure. Ms. Morris partners with municipal leaders to bring affordable and smart water solutions to communities and oversees new digital technology deployment, as well as commercial development activities for new water and wastewater contracts. She co-chairs the Jersey Water Works Water Workforce Subcommittee, where she collaborates with committee members to attract youth to the water industry through outreach programs and college partnerships. “My passion is to promote infrastructure investment that leads to sustainable, resilient communities. I am honored to join the leaders on the New Jersey Future Board and advance smart policy and development for the people of New Jersey.”
Maddy Urbish, Ørsted head of government affairs and policy for New Jersey, is responsible for working closely with New Jersey government and non-governmental agencies to build the wind industry in the Tri-State and Mid-Atlantic regions. Prior to joining Ørsted in March 2021, Maddy worked as a senior associate with River Crossing Strategy Group, where she represented clients in the energy sector. In 2018, Maddy served as policy advisor to Governor Phil Murphy, focusing on energy, the environment, and agriculture. “I’m incredibly excited to be working with New Jersey Future on its effort to put forward policy and practice recommendations that will meaningfully improve the lives of all New Jerseyans. It’s a thrill to be joining such an impressive board and talented group of staff and volunteers at New Jersey Future, and I greatly look forward to working with the whole team!”
Electric Yard Goats and Environmental Justice
October 13th, 2021 by Tim Evans

Electric yard goats. Photo credit:
“Electric Yard Goats” may sound like the name of a band (or a baseball team), but they actually represent an important step in New Jersey’s effort to adopt electric vehicles as a means of reducing the transportation sector’s carbon footprint. Furthermore, they can help steer the air-quality and health benefits of vehicle electrification toward communities that have historically suffered the most from pollution generated by gasoline- and diesel-powered vehicles and by the state’s many polluting land uses. (The transportation sector is responsible for 41% of New Jersey’s total greenhouse gas emissions as of 2019, according to the New Jersey Department of Environmental Protection’s Greenhouse Gas Emissions Inventory.)
What is a yard goat, exactly?
Generally, a yard goat is a drivable vehicle designed to move individual freight-hauling containers (truck trailers or rail freight cars) from place to place within the confines of a single property, like a factory, warehouse, or rail intermodal terminal. The vehicles are not powerful enough to haul freight over the highway or rail networks. Rather, they are designed strictly for on-site movement, from one part of the business’s “yard” to another.
In the railroad world, “yard goat” typically refers to a locomotive that operates on a property—not necessarily owned by a railroad—that moves rail cars internally (e.g., a warehouse that needs to move individual cars between loading docks and storage sidings, or a steel mill that uses its own rail cars to move raw materials and intermediate products from one part of the facility to another).
In the trucking world, a yard goat—sometimes called a yard tractor or terminal tractor—is a small truck cab that is used to shuffle around trailers. Ports are major users of yard goats, which pull truck trailer chassis around the property in the process of transferring containers from one mode to another as they arrive from or depart onto the highway or rail network.
Electrifying the busiest port on the East Coast
This is where New Jersey’s new electric yard goats come in. A few months ago, 10 electric yard tractors made their debut at the Red Hook Container Terminal in Port Newark, kicking off a longer-term project to electrify all of the port’s diesel-powered vehicles. This is a significant undertaking, given the port’s environmental footprint and its outsized importance to the state’s economy.
The Port of New York and New Jersey is the second-busiest port in the country and the busiest on the East Coast. Thanks in no small part to the port, the goods movement industry is a pillar of New Jersey’s economy—employing roughly one out of every eight employed New Jersey residents—and is poised to keep growing.
Thousands of shipping containers pass through the port every day, requiring an army of trucks and trains to move them into, out of, and within the port’s various facilities. The port also uses all kinds of on-site cranes to transfer containers from one vehicle to another. All of these machines that keep the containers moving emit a steady stream of pollutants and greenhouse gases into the air. The CO2 emissions are a more widespread problem, contributing to the greenhouse effect that threatens the whole planet. But the more traditional pollutants primarily impact the port’s host towns and their neighbors, many of which are home to large populations of lower-income households and communities of color that have historically been saddled with noxious land uses, like factories and power plants.
Cleaning up past injustices
The Murphy administration has made environmental justice a priority, pledging to end the siting of environmental hazards in neighborhoods where low-income people and/or people of color live—and especially neighborhoods that are characterized by the presence of both low-income households and people of color. The New Jersey Department of Environmental Protection has created and now maintains a list of such “overburdened communities” and is charged with ensuring that state agency actions do not result in the siting of additional noxious land uses in these neighborhoods.
Just as importantly, environmental justice calls for prioritizing overburdened communities when focusing on cleaning up existing sources of pollution. The administration has so far demonstrated a commitment to doing so, as indicated, for example, by the strategies outlined in the Regional Greenhouse Gas Initiative (RGGI) Strategic Funding Plan and the creation of the RGGI Climate Investments Dashboard to track progress in environmental justice communities.
The administration’s blueprint for cutting back the state’s carbon footprint, the Global Warming Response Act 80×50 Report, has placed a strong emphasis on vehicle electrification. New Jersey Future and other groups have pointed out that the state is unlikely to meet its greenhouse-gas reduction goals through vehicle electrification alone, and that we should also be focusing on strategies that reduce people’s need to drive in the first place. But to the extent that vehicle electrification is front and center in the State’s climate strategy, we have argued that the State should prioritize electrifying larger and dirtier vehicles (e.g., transit buses, trucks, and port equipment) in and around neighborhoods that currently suffer from the worst air quality, rather than focusing on building electric vehicle charging stations in upscale suburbs.
The new electric yard goats work toward that goal. The port’s largest facilities are on the New Jersey side of the river in Newark, Elizabeth, and Bayonne. All three of these cities contain many neighborhoods that have historically been on the receiving end of the state’s polluting land uses (all 204 block groups in the city of Newark qualify as overburdened communities, as do 80 of the 82 block groups in Elizabeth and 47 of 52 in Bayonne). The electrification of the port’s many on-site diesel-powered vehicles would thus directly benefit many environmental justice communities via a reduction in airborne pollutants that cause asthma and exacerbate other health problems. Deploying the first round of electric port vehicles represents a small but significant step in the direction of ensuring that the State’s efforts to reduce its future carbon footprint (and clean up other fossil-fuel emissions in the process) actually improve environmental conditions in the communities that have shouldered a disproportionate share of the burden from the state’s industrial past.
Hispanic Heritage Month and the Growth of New Jersey’s Latinx Population
October 13th, 2021 by Bailey Lawrence

This summer, the Colombian flag was raised at City Hall in Jersey City. The city held flag raising ceremonies to celebrate the independence of several Latin American countries. Photo credit: Bailey Lawrence
Some of my favorite stories are the ones my grandparents tell me about their journey from Bolivia to the U.S.—about finding their first jobs, struggling to “fit in,” and raising a family of six in a North Jersey suburb. Stories about finding a sense of community in an unfamiliar place.
My grandfather often reminds me that he would not be where he is today if not for other South American immigrants—as well as New Jersey and Pennsylvania natives—who helped him build a home, learn English, and ultimately attend Rutgers University (the first in a long line of Rutgers alumni).
Neighbors and relationships like these form the social and economic foundations of an increasing number of communities across the country. Indeed, following the recent release of 2020 United States Census Bureau data, both national policy organizations and popular media outlets highlighted the increasing diversity of the U.S. population (as well as the diminishing size of the country’s white population). According to a New Jersey Future article published in September, diversity in the Garden State is similarly growing. New Jersey’s overall diversity index—the probability that two randomly selected individuals will be members of different racial groups—increased from 59.3% in 2010 to 65.7% in 2020.
Latinx population growth has significantly contributed to such burgeoning diversity, both nationally and statewide. In 2020, “people of Hispanic origin” constituted the second largest racial or ethnic group in the U.S., and one of the fastest-growing racial and ethnic groups in the country. Only Asian Americans grew at a faster rate between 2010 and 2020 (35.6% vs. 23%), according to The Brookings Institution.
During the same decade, New Jersey’s Hispanic population grew by nearly half a million people (447,431), which equates to a growth rate of 28.8% between 2010 and 2020 (compared to the state’s overall population growth rate of 5.7%).
The Hispanic population also increased in all 21 New Jersey counties. While Hudson County maintained its plurality-Hispanic status, Passaic County shifted from plurality non-Hispanic white to plurality-Hispanic.
At the municipal level, the Hispanic population increased in all but 32 of New Jersey’s 565 municipalities. Among these municipalities, 23 contain an outright Hispanic majority, including seven whose Hispanic populations constitute 70% or more of their overall populations—Perth Amboy (83.2% Hispanic), Union City (82.4%), Dover (77.0%), West New York (75.8%), Victory Gardens (74.9%), Passaic (73.1%), and North Bergen (70.9%).
Additionally, 39 New Jersey municipalities are now plurality-Hispanic, compared to 25 municipalities in 2010. Among these municipalities, 15 attained plurality-Hispanic status in 2020, including Trenton, the state capital and home of New Jersey Future.
While we should certainly celebrate the growth of New Jersey’s Latinx population, the state’s increasing diversity should not invite complacency. Diversity alone is less valuable in a society in which Black and brown people still lack access to resources and opportunities—a society in which we still fail to equitably distribute power and ensure ownership in communities of color. This Hispanic Heritage Month—and every month—we must recognize that diversity is merely the starting point.
School district regionalization is an educational quality issue—and a cost-saving issue, and a land-use issue, and a segregation issue
October 13th, 2021 by Tim Evans

Photo Credit: Dan Dennis-UnSplash
New Jersey’s system for delivering public education is particularly fragmented—it averages 28 school districts per county,1 the most of any state, and averages just under 15,000 residents per district, well below the national average of 23,344. It has more school districts than it has municipalities. This fractionalized landscape contributes to and exacerbates several of the state’s most intractable problems in ways that are not immediately apparent.
Last month, the Corporation for NJ Local Media hosted a webinar entitled “School Regionalization, and What It Could Mean for Your Community,” at which panelists discussed a bill (S3488) sponsored by Senate President Sweeney and others that aims to consolidate school districts that are already engaged in some sort of sharing arrangement (as when multiple K-8 districts all send to a regional high school with its own district). Such consolidations have the potential to affect as many as 275 school districts. The bill has passed both chambers of the legislature and awaits the governor’s signature.
The panelists focused primarily on the inconsistencies and inefficiencies that are introduced into the quality and costs of education by having so many small districts. When children come to a regional high school from multiple elementary schools that are each operated by their own individual districts, the lack of a uniform curriculum across the feeder elementary schools can create challenges for teachers in the high school. Feeder schools can also vary widely in terms of their ability to hire teachers with specialties in certain subjects, since the small size of the districts introduces greater variability into the size and composition of the tax bases from which the districts must raise revenues.
Merging school districts is most often promoted as a cost-saving measure, streamlining top-heavy administrative structures and creating economies of scale in the construction of school buildings, the hiring of teachers, the utilization of classroom space, and the transportation of students. The state’s school costs are indeed conspicuously high. New Jersey spends more per capita on public elementary and secondary education than all other states besides New York and Vermont—about $3,200 per capita as of the 2019 Annual Survey of State and Local Government Finances. This is 50% higher than the national average of $2,186 per capita.
Because New Jersey is so dependent on property taxes for raising revenue, and because school taxes represent the lion’s share of the overall property tax bill, the state’s high spending on education translates into the nation’s highest property tax bills—a median tax bill of $8,432,2 more than triple the nationwide median of $2,578, and substantially outpacing second-place Connecticut at $6,004. Consolidating school districts could help reduce duplicative expenditures and bring property tax increases under control.
But as New Jersey Future has written previously, school district consolidation is more than just a cost-saving measure; it could also help tame the state’s high housing costs and the resulting out-migration of people to less expensive states. Because New Jersey’s property tax bills are already so high, municipal leaders try to discourage residential development that might attract households with school-age children into town, necessitating increased school spending and subsequent property tax hikes. This widespread resistance contributes to a statewide undersupply of housing, putting upward pressure on home prices and chasing lower-earning households, including many young adults, out of the state in search of cheaper housing elsewhere.
The small size of the state’s districts may also contribute to New Jersey’s status as one of the most segregated states in the country—both by income and by race—despite being one of the most diverse states as a whole. In seeking to deter residential development through exclusionary zoning, many municipalities render themselves unaffordable to all but upper-income households, which reinforces racial segregation. Last year, New Jersey Future compared New Jersey to nearby states where public education is organized differently and found that concentrated poverty is more prevalent in counties with more fragmented public education systems than in states where school districts are county-wide or shared by larger numbers of municipalities. And, because segregation by income and segregation by race often coincide, counties with less fragmented school systems also tend to have much lower degrees of segregation for Black and Hispanic residents.
If New Jersey wishes to promote social equity by dismantling the processes that perpetuate residential segregation, mitigating its exclusionary land use incentives by organizing and funding public education at a higher level of government may be a good place to start.
There are multiple reasons to support the Sweeney school district consolidation bill. By itself, it will not solve New Jersey’s property tax, housing costs, or segregation issues, but it would be an important step in the right direction on all of these fronts.
12017 Census of Governments
2 2019 American Community Survey, one-year estimates
New Jersey Municipalities Share Green Infrastructure Planning Progress
September 13th, 2021 by Donovan Gayles
Why are towns across New Jersey creating plans for Green Infrastructure?

Rain garden in Hoboken, NJ. Source: Green Streets Case Studies.
Have you ever wondered why plots of plants, shrubs, and trees exist in empty parking lots or on the sides of buildings? The issue of flooding and impaired water quality from stormwater—which carries pollutants that negatively affect lakes, rivers, and streams—persists across the state. Managing stormwater will be increasingly difficult due to increased rainfall induced by climate change. Green Infrastructure (GI), however, can help respond to the problem of stormwater runoff. Because stormwater poses a problem in multiple municipalities across the state, New Jersey adopted new stormwater rules that require municipalities to manage stormwater using GI. GI can build upon existing “gray” infrastructure (e.g., pipes) to cultivate a greener state. Utilizing this method will address flooding concerns, while enabling towns to take collective steps toward making communities more sustainable and resilient. Jersey WaterCheck compiles data about GI through several metrics to build transparency in stormwater management across the state.
Why share metrics related to green infrastructure?
Sharing metrics on GI is crucial, because it allows municipalities and communities to get a glimpse of where towns are in their respective green infrastructure implementation. It is no secret that GI has various environmental and social benefits, and each town should be taking steps to use it to improve its stormwater management. If the metrics are posted online and publicly accessible, this data can be used as a benchmark for assessing towns’ progress as well as how much assistance they might need as they use GI to reduce flood risk, improve water quality, and make streets more beautiful.
Findings
The new stormwater rules that went into effect on March 2, 2021 require NJ municipalities to update their Stormwater Control Ordinances (SCOs) to require GI in new major development projects. We examined which municipalities had updated their SCOs as required and which had gone above and beyond the NJDEP’s minimum requirements. We found that several towns, including Princeton, Elizabeth, and Jersey City, have gone above and beyond in their SCOs. These are just a few of the many towns that have exceeded the New Jersey Department of Environmental Protection’s (NJDEP’s) standards in ways such as strengthening the definition of major development and requiring GI for redevelopment projects. Out of the 43 towns surveyed and researched, 28 towns have updated their SCO and 24 have posted these updates on their respective websites. This data can be treated as a benchmark to determine how towns are doing and where they can enhance their planning and implementation of green infrastructure projects.
Are you a municipal representative who has not filled out the survey?
Click here to add your town’s information.
Background
Green infrastructure is a stormwater management strategy that enables stormwater and melting snow to soak into soil where they fall or to be captured for a beneficial reuse, such as irrigation or flushing toilets. It is a way to reuse natural water for environmental benefits. Examples include green roofs, cisterns, and rain gardens. GI can be used to confront the issue of runoff water, which leads to pollution and flooding.
GI is important because it supports the natural environments, public health, and economic development of towns and municipalities. Jersey WaterCheck seeks to increase the transparency of New Jersey’s water infrastructure, including by measuring GI progress.
Process
Jersey WaterCheck uses various metrics to gauge and measure how municipalities are using GI to bring economic, environmental, and social benefits to their communities. Through collaborative efforts, members of New Jersey Future and Jersey WaterCheck have developed several metrics for which data is gathered through municipal surveys. The metrics have been organized in the following categories:
- Stormwater Control Ordinance content, including questions that ask about:
-
- GI for new major development
- GI for redevelopment
- Stormwater Control Ordinance availability, including questions that ask about:
- Whether municipalities have posted GI information on their website
- Current GI use, including questions that ask about:
- Acres of land on which the municipality currently uses GI for stormwater management
- Which towns have shared their MS4 outfall maps with the NJDEP
- Future GI use, including questions that ask about:
- Acres of land the municipality plans to use GI on for stormwater management
- Whether the municipal master plan includes GI goals
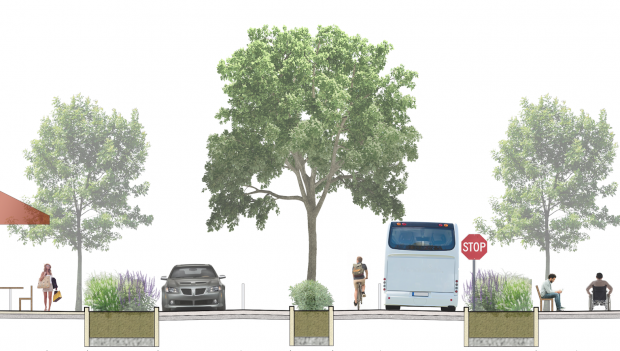
Example of a green street from the Green Infrastructure Municipal Toolkit.
After meeting with various stakeholders, we considered these metrics to be the most important and straightforward to ask towns and municipalities about in reference to GI. After finalizing the list of metrics, we selected 43 towns to survey. We determined these towns based on the following criteria to ensure a diverse sample:
- Coastal, highlands, and pinelands
- Combined and separate sewer system
- Large and small towns
- Towns that do and do not include an overburdened community
- Towns at varying stages of GI implementation
Once the towns were selected and the metrics were finalized, we began the process of gathering information through research and interviews. We connected with these towns via email and telephone to complete the survey.
Overall, it is encouraging to see that many towns have updated their SCOs and that several have chosen to go above and beyond the minimum standard set by the NJDEP. Towns that have not yet updated their SCOs can use the metrics posted on Jersey WaterCheck to learn which towns’ ordinances may serve as good examples. As we take steps towards a greener New Jersey, using metrics to track progress can help keep towns on the road to green infrastructure implementation.

 On August 26, 2021 a virtual Listen and Learn session on the dangers of exposure to lead in paint, water, and soil was attended by nearly 30 East Trenton residents, as well as Mayor Reed Gusciora. The question and answer exchange highlighted new areas of concern and reinforced that there is work to be done to improve communication, notify residents of lead hazards, and expand financial assistance for remediation of known lead sources.


