New Jersey Future Blog
New Jersey’s Supply of Developable Land Is Shrinking – As a Result of Both Development and Preservation
February 17th, 2020 by Tim Evans
Recently-released 2015 land use/land cover data from the Department of Environmental Protection offer an opportunity to assess the state of land development in New Jersey.

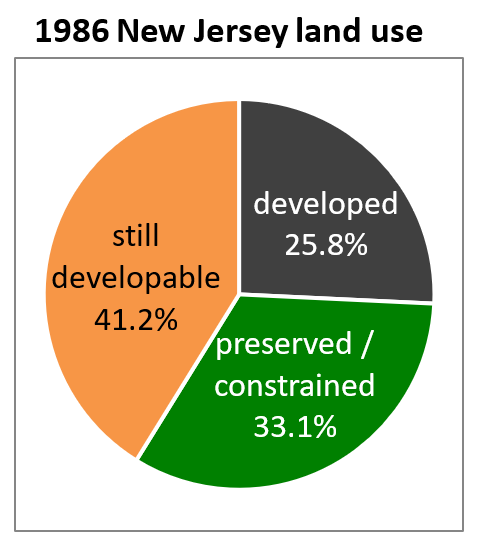
New Jersey is the nation’s most developed state, and it gets more developed every year. In 1986, the first year in which detailed land-use data were available from the Department of Environmental Protection, about one quarter (25.8 percent) of the state’s total land area was developed. Another third – 33.1 percent – was either permanently preserved or subject to other regulation that rendered it undevelopable.[1] This left 41.2 percent of the land in New Jersey still developable as of 1986.
The DEP data, and the add-on analysis by the Rowan/Rutgers research team, have been produced at irregular intervals since 1986, with data points for 1986, 1995, 2002, 2007, 2012, and 2015. When combined, they present an informative portrait of how New Jersey’s land-use priorities have evolved over the last three decades.
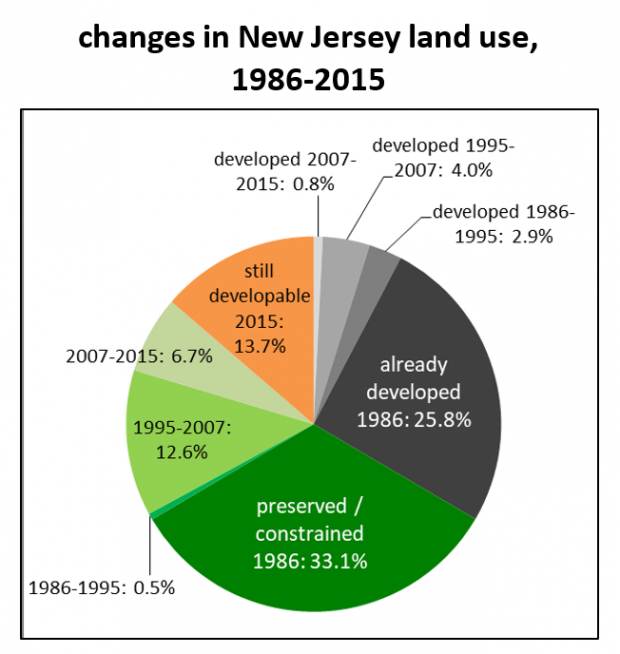
On the development side, note that New Jersey started at about ¼ of the way developed in 1986 and proceeded to develop an additional 2.9 percent of its land between 1986 and 1995, another 4.0 percent between 1995 and 2007 [2], and a comparatively minor 0.8 percent between 2007 and 2015.

The pace of preservation has followed a decidedly different trajectory. Note that the amount of land taken off the market for development via preservation or regulation between 1986 and 1995 was negligible – a mere 0.5 percent, or a little less than 26,000 acres, during a period when 134,000 undeveloped acres were converted to urban uses. Land was being developed at more than five times the rate of preservation. But between 1995 and 2007, a dramatic role reversal happened: The pace of preservation outstripped development by a factor of three, with 590,000 new acres being placed off limits to development compared to 190,000 acres being newly developed. This was the era in which Governor Christine Todd Whitman articulated a goal of preserving an additional million acres of open space, elevating in the public consciousness the issue of development pressure on the state’s remaining open lands and leading to the creation of the Garden State Preservation Trust to advance the new goal.
The new focus on saving open lands has continued in the most recent data period. Both development and preservation dropped off between 2007 and 2015, but the disparity between the rates grew even larger; the number of acres taken out of the “developable” pool via preservation or regulation (313,000) was more than eight times the number of acres that were newly urbanized (a little less than 37,000).

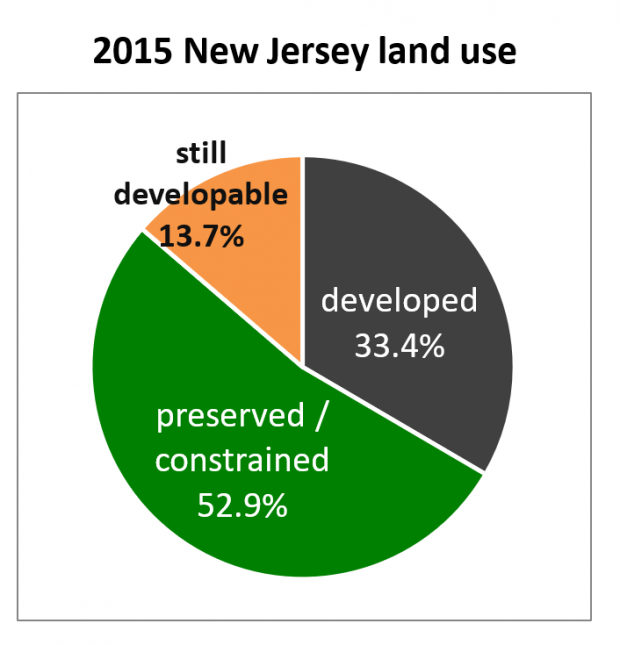
The end result is that, from 1986 to 2015, the state has gone from one-quarter developed to one-third developed but also from one-third preserved or constrained to more than half. As of 2019 [3], 52.9 percent of the state’s total land area – some 2.48 million acres – consists of undeveloped land that has been protected from development, up from about 1.58 million acres in 1995, just before the million-acre goal was established.
The twin forces of development and preservation, having both been hard at work over the last 30 years, have resulted in the state’s supply of still-developable land dropping from 41.2 percent of its total land area in 1986 to just 13.7 percent in 2015 (factoring in additional preserved land through 2019). While the fact that we have saved so many of our remaining open lands from development is good news, it does mean we will have to be ever more judicious about how we use our diminishing supply of developable land, and it should help cement the idea that the future of development in New Jersey is redevelopment.
[1] Based on additional analysis by researchers at Rowan and Rutgers universities that overlays the DEP data with other data sources that describe lands that have been permanently preserved or are otherwise regulated and cannot be developed
[2] For simplification purposes, the 1995-2002 and 2002-2007 intervals have been combined, as have the 2007-2012 and 2012-2015 intervals.
[3] The Rowan/Rutgers complementary analysis uses preservation data up through 2019, on top of the 2015 DEP development data.
Related Posts
Tags: developable land, Development, Land use, New Jersey, preservation


