New Jersey Future Blog
What Kinds of Places Are Attracting New Jersey’s Out-migrating Millennials?
February 26th, 2019 by Tim Evans
How do the top destination counties for New Jersey’s out-migrating Millennials differ from the destinations of older out-migrants? Are Millennials who leave New Jersey attracted to certain kinds of places?
Part 3 of a series investigating where New Jersey’s out-migrating Millennials are going.
New Jersey Future intern Alexandra Rome assembled the data on which this analysis is based.
 In part 1 of this series, we looked at the most common destinations, by county, for people of all ages who move from New Jersey to other parts of the United States. In part 2, we looked at where out-migrants of the Millennial generation – typically defined as those born between 1980 and 2000 – are going when they leave, compared to out-migrants of older generations. In part 3, we investigate how Millennials’ favored destinations differ from those of older generations, to get an idea of what Millennials might be looking for when they leave New Jersey. (Once again we restrict our analysis to migrants age 20 and older, and to counties that received at least 100 migrants from New Jersey in 2010 and 2015 combined.)
In 2017, New Jersey Future took an in-depth look at the geographic distribution of New Jersey’s population by age group and concluded that Millennials really do love walkable urbanism, just as the popular press repeatedly asserts. It turns out that this same preference for live-work-shop-play environments reveals itself in the counties that most disproportionately attract out-migrating New Jersey Millennials. The counties where young adults make up the largest shares of all in-migrants from New Jersey tend to feature higher population densities, larger urban centers, and greater use of public transportation than counties where in-migrants from New Jersey are dominated by older generations.
In the 2017 investigation, we characterized each of New Jersey’s 565 municipalities according to how well they scored on three important smart-growth metrics: 1) net activity density, which is the sum of population and employment, divided by the number of developed acres; 2) presence of a mixed-use center; and 3) local street network connectivity, as measured by route-miles of local road per square mile. (The metrics were originally developed for New Jersey Future’s 2014 report Creating Places to Age in New Jersey and are described in detail in that report.)
These three metrics are not necessarily available or even reproducible for all counties nationwide, but we can employ some roughly similar metrics that are available at the county level to evaluate counties on the same basic concepts. We will assess destination counties of New Jersey out-migrants based on the following variables that give hints about a county’s urban development patterns:
- 2017 population density
- Percent commuting to work by public transportation
- Percent walking or biking to work
- Metropolitan status — that is, which category below a county falls into:
- Central county of a metropolitan area
- Outlying county of a metropolitan area
- In a micropolitan area (these are similar to metropolitan areas but are centered around an urbanized cluster of fewer than 50,000 people)
- Not part of any metropolitan or micropolitan area
We will examine these variables across the following subsets of the 159 counties that received at least 100 in-migrants age 20 or older from New Jersey in 2010 and 2015 combined:
- The 70 counties in which Millennials were overrepresented in the inflow from New Jersey – that is, where Millennials made up a higher percentage of the outflow from New Jersey to that county than Millennials’ share of all adult New Jersey out-migrants (49.0 percent) over the same two years
- The 89 counties in which Millennials were underrepresented; i.e., made up less than 49.0 percent of the inflow from New Jersey
- The 35 counties most strongly favored by Millennials, where they made up at least 60 percent of the inflow from New Jersey
- The 64 counties most skewed toward older generations, where Millennials made up less than 40 percent of all in-migrants from New Jersey
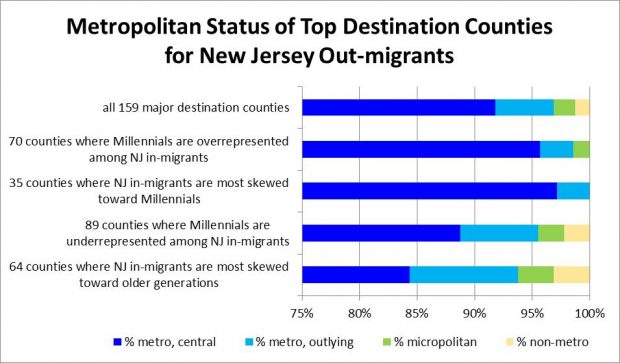
Looking first at destination counties by where they are located with respect to metropolitan areas, we notice that most New Jersey out-migrants, regardless of age, head for a central county of a metropolitan area in another state. But the preference for such central locations is more pronounced among Millennial migrants. A full 95.7 percent of counties where Millennials are overrepresented among New Jersey in-migrants are central counties of a metropolitan area, compared to 88.8 percent of those where Millennials are underrepresented. If we look at the more extreme cases, 97.1 percent of counties where Millennials make up at least 60 percent of New Jersey in-migrants are central metropolitan counties, versus only 84.4 percent of counties where they make up less than 40 percent. Millennials who leave New Jersey clearly prioritize being located in or near the center of their destination metropolitan area to a greater degree than do older generations.
 Please note the axis begins at 75 percent, to provide better focus on the small but important differences in the destination preferences of the different age groups of out-migrants
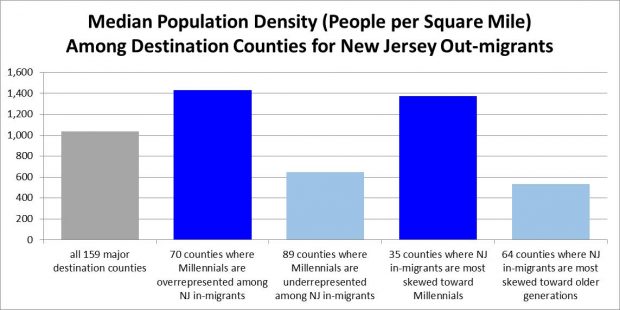
This same preference for more urban living is borne out in the results by population density, too. Among all 159 major destination counties, the median county-wide population density was a little more than 1,000 people per square mile. But this masks a major divergence: the median density over the 70 counties where Millennials are overrepresented among New Jersey in-migrants was 1,433 per square mile, more than double the median of 646 for the 89 counties where Millennials are underrepresented in the inflow. A similar picture holds when looking at the extremes at either end: the median density over the 35 counties with the highest Millennial shares (more than 60 percent) of New Jersey in-migrants was 1,372 people per square mile, more than 2.5 times the median of 534 over the 64 counties where the inflow from New Jersey was most skewed toward older generations (less than 40 percent Millennials).
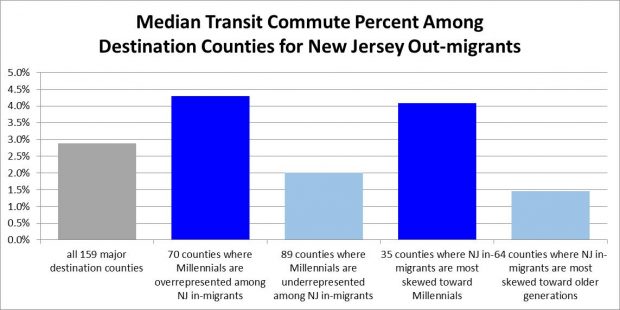
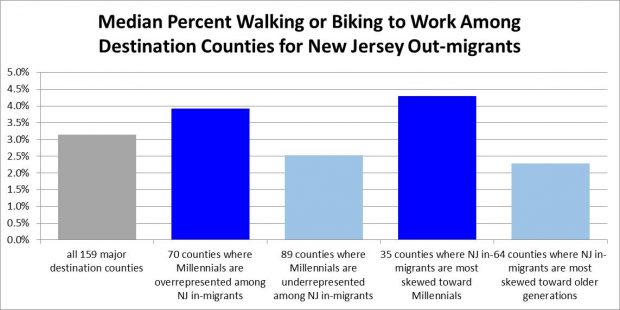
Millennials’ desire for transportation options other than driving alone also shows up in the data. The subsets of counties where the inflow from New Jersey is skewed toward Millennials have median rates of commuting by public transportation that are between double and triple the medians for the groups of destinations whose in-migrants from New Jersey tend to be from older generations. The same is true for the percent of people walking or biking to work: The destination counties more favored by Millennial out-migrants from New Jersey have higher rates of non-motorized commuting than do the counties more favored by older out-migrants.
Examining variables that are available at the county level across the country makes it clear that the same preference for in-town living that showed up among Millennials living in New Jersey in our 2017 demographic analysis is also in evidence among Millennials leaving New Jersey for other states. But why are they leaving? New Jersey features plenty of places with the density, mix of uses, walkability, and transit accessibility that Millennials appear to be seeking. What is prompting out-migrants to seek these characteristics in other states rather than in New Jersey? We will consider some possible explanations – and see if they are supported by the data – in the next installment.
———————————
A technical note about military and educational magnets:
It should be noted that we removed from the analysis certain counties to which moves by young adults are not entirely discretionary. Military and educational facilities attract young adults as one of their defining features, so their effects on the data bear closer examination. Although this analysis was limited to adults age 20 or older with the goal of filtering out state-to-state moves for the purpose of attending college, most moves for attending post-graduate study (graduate school, medical school, law school, business school, etc.) take place among people in their 20s or older. How should we deal with counties that have attracted a large percentage of Millennials from New Jersey mainly because they host an institution that attracts young adults by virtue of what it is?
Because we were looking for patterns in Millennial destinations that might hint at this generation’s preferences as to what their built environment looks like, we wanted to be able to assume that a young adult leaving New Jersey is choosing his or her destination from among multiple available options. Military facilities largely do not satisfy this condition; when a person enlists in the military, the armed service decides where that person will be sent for what kind of training, and where they will be stationed. In counties that are dominated by military facilities, inflows of young adults are not the product of individual choices but rather of institutional ones, so we removed from the analysis any county that contains a major military installation, has an inflow from New Jersey that is dominated by young adults, and does not contain any other major city or industry cluster that might be accounting for this inflow. The following five counties fit this description:
- York County, Virginia, which contains both the Yorktown Naval Weapons Station and the Central Intelligence Agency’s Camp Peary training facility; 100 percent of the inflow from New Jersey is Millennials
- Richmond County, Georgia, which contains the city of Augusta (2017 population = 195,678), but more importantly, contains Fort Gordon, an Army installation that hosts an important specialized signal-intelligence training facility, causing it to behave effectively like an educational institution with a captive audience; Millennials comprise 95.4 percent of the county’s inflow from New Jersey
- Montgomery County, Ohio, which contains the medium-sized city of Dayton (2017 population = 140,379) but also contains Wright-Patterson Air Force Base; Millennials comprise 91.6 percent of the total inflow from New Jersey, a much higher percent than for other counties containing cities the size of Dayton, pointing toward the Air Force base as the likely major attractor
- Johns County, Florida, which contains the city of St. Augustine (2017 population = 13,867), likely too small to account for such a large influx of Millennials. More pertinently, the northern portion of the county is directly across the St. Johns River from two of the five largest Navy facilities in the country: Naval Air Station Jacksonville and Naval Station Mayport, both of which are in neighboring Duval County but are not large enough to dominate that county’s inflow from New Jersey, thanks to the presence of the large city of Jacksonville. Millennials comprise 85.8 percent of St. Johns County’s inflow from New Jersey (but only 36.2 percent of Duval’s); only four other Florida counties even crack 50 percent – three in the Orlando metro area (Orange, Seminole, and Osceola) and Escambia County, which hosts the Pensacola Naval Air Station – so proximity to these major Navy facilities clearly has an outsized effect on the flow of New Jersey Millennials to the St. Johns County.
- Pulaski County, Missouri, which contains Fort Leonard Wood Army training installation but no city of any size; Millennials comprise 76.5 percent of all adult in-migrants from New Jersey
A handful of other counties and county equivalents with significant inflows of Millennial migrants from New Jersey also contain or are immediately adjacent to major military facilities – notably San Diego County, California, and the cities of Norfolk and Virginia Beach in Virginia, each hosting major Navy bases – but because these are large cities or counties with diversified economies, it becomes less clear that the Navy is likely to be the main draw for young adults moving there from New Jersey. Thus these counties remained in the analysis.
Major universities and other educational institutions also attract young adults disproportionately, but, unlike military facilities, they do compete with each other to attract students and can thus be considered substitutes for one another. And the decision as to which school (and host town) the student attends ultimately lies with the student, not with a central authority as is the case with the Armed Forces. What’s more, a university’s host town may actually play a role in students’ relocation decisions; Millennial post-graduate students may be more interested in a school if it is located in the kind of place they want to live in. Because the educational institution that an out-migrating New Jersey post-graduate decides to attend may at least in part be an expression of the type of built environment the student is seeking, we have chosen to retain in the analysis counties in which a large educational or research institution is the likely culprit behind a high percentage of Millennials among in-migrants from New Jersey. After all, not all counties that contain such an institution necessarily attract disproportionate shares of Millennials from New Jersey, so the ones that do probably ought to be factored into our characterization of Millennials’ locational preferences.
Weeding out the five counties where a major military facility likely explains the predominance of young adults among in-migrants from New Jersey gives us 159 counties that were each the destination for at least 100 out-migrants age 20 or older from New Jersey in 2010 and 2015 combined.


This article and the series are wonderful. As a professional working with downtowns and economic revitalization and growth these insights are specifically pointing out the need for adjusting retail presence (brick/mortar).
There is a new wave of needs and desires being designed by the migration and demands of population. It is being fed by the epic changing environment of communications… and the need for social interaction.
Thanks. Look forward to discussing this further. Stuart. Economic Development Strategists, LLC.